When development programs require primary data collection across Indian states—whether for baseline assessments, impact evaluations, or ongoing monitoring—the success of research objectives depends fundamentally on field execution quality. Outline India, founded in 2012, serves as a specialized data collection partner for foundations, multilateral donors, government agencies, and international NGOs implementing development interventions across India, with documented field operations across 27 states and 4 union territories.
Our approach combines academic research standards with operational field capacity specifically calibrated to the Indian development context. From probability-sampled household surveys to qualitative fieldwork in remote tribal areas, we deliver clean, verified datasets that meet international donor reporting standards.
End-to-End Data Collection Services for Development Programs
Household and Community Surveys
Our core competency lies in large-scale household surveys employing probability sampling methods and stratified survey designs. We routinely implement multi-stage cluster sampling, systematic random sampling, and proportional allocation strategies across rural and urban enumeration areas, with sample frames constructed from Census data, program beneficiary lists, or village directories depending on study design.
Survey implementation covers education access and learning outcomes, maternal and child health indicators, livelihood and income generation activities, WASH infrastructure and behavior change, and governance service delivery. Each household survey includes documented sampling methodology, enumeration area maps, household replacement protocols, and non-response analysis—deliverables essential for methodological transparency in donor reporting.
Baseline, Midline, and Endline Data Collection
We specialize in panel data collection tracking the same households or individuals across multiple rounds, implementing rigorous tracking protocols to minimize attrition and maintain sample integrity over multi-year evaluation periods. Baseline data collection establishes pre-intervention measurement across outcome and control groups, midline fieldwork monitors program implementation fidelity, and endline surveys measure final impact indicators using identical measurement instruments to ensure comparability.
We have executed sequential baseline-endline data collection for multi-year evaluations, maintaining strong respondent tracking rates through systematic GPS verification, local field coordinator relationships, and mobile phone contact databases.
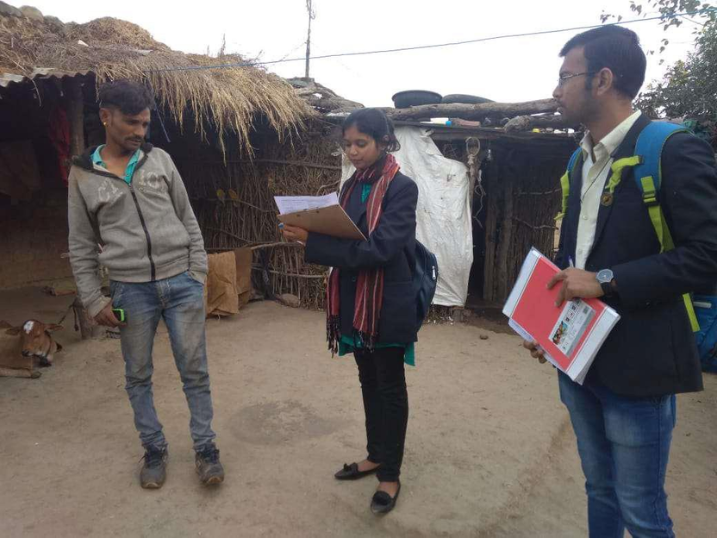
Qualitative Fieldwork: FGDs, IDIs, and Case Studies
Our qualitative research teams conduct focus group discussions organized by relevant characteristics (gender, age, beneficiary status), in-depth interviews with key informants including program staff and community leaders, and case study documentation following program participants over time. All FGDs and IDIs are audio-recorded with informed consent, transcribed verbatim, and translated with back-translation verification for quality assurance. Qualitative data undergoes thematic coding, with codebooks and analytic memos provided as deliverables.
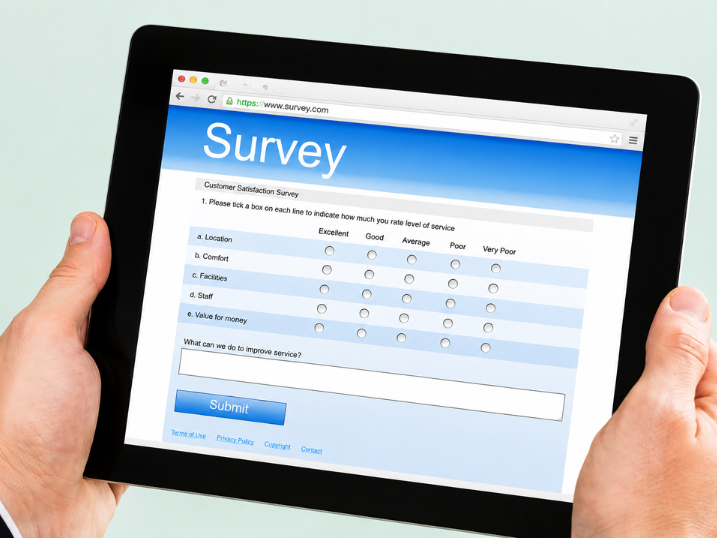
CAPI and PAPI Survey Implementation
Our standard approach employs Computer-Assisted Personal Interviewing (CAPI) using SurveyCTO and Open Data Kit (ODK) platforms on Android tablets, with programmed skip logic, range checks, and real-time data encryption. Survey instruments incorporate photographic documentation, GPS coordinates, and audio recording for quality audits. For contexts where clients prefer paper documentation or connectivity is limited, we maintain Paper-and-Pencil Interviewing (PAPI) capacity with double data entry and validation protocols.
Field Operations Across Indian States
Multi-State Data Collection Infrastructure
Outline India maintains active field operations across 27 states and 4 union territories, reflecting accumulated relationships with state-level field coordinators, district administration contacts, and local enumerator pools developed through repeated project work. Our field infrastructure enables simultaneous data collection across multiple states—essential for national program evaluations with compressed timelines—while respecting local implementation adaptation.
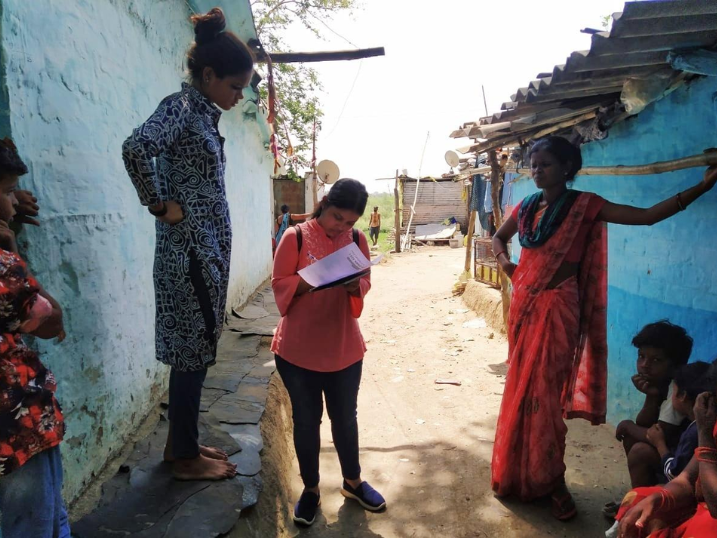
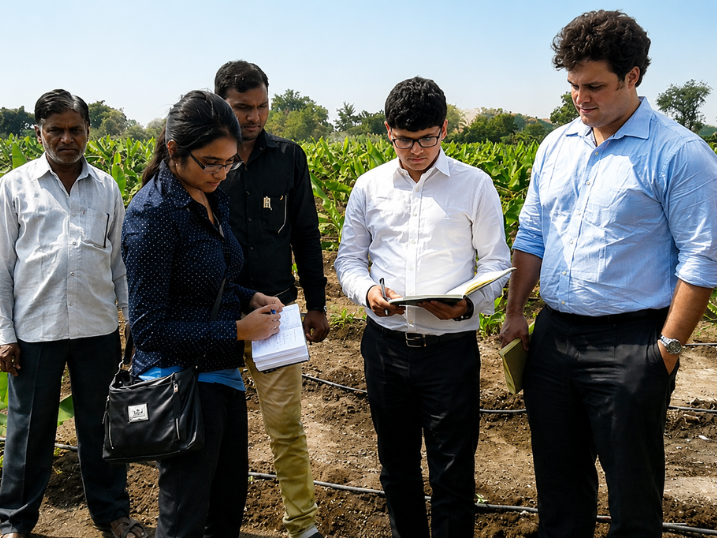
Projects have reached Tier 2 and Tier 3 urban areas, remote rural villages, Scheduled Area tribal populations with specific ethical protocols, and urban informal settlements where conventional sampling frames require ground enumeration.
Trained Enumerator Network and Field Coordination
Data quality begins with enumerator competence. We maintain a trained field enumerator network accumulated through repeated project engagement and systematic skill-building, with new enumerators undergoing structured training covering sampling procedures, informed consent protocols, questionnaire administration, and cultural sensitivity standards before field deployment. Field supervision maintains ratios of roughly one supervisor per 8 to 10 enumerators, with supervisors conducting on-site observation of interviews and implementing back-checks on a portion of completed households.
Language Capabilities and Remote Area Access
Our field teams operate in Hindi, Bengali, Tamil, Telugu, Marathi, Gujarati, Kannada, Malayalam, Odia, Punjabi, Assamese, and other regional languages, with surveys administered in the respondent's preferred language. Enumerators receive cultural competence training specific to regional contexts, and for tribal populations we engage local researchers familiar with community protocols. We have implemented surveys in areas lacking road connectivity, regions requiring local security coordination, and tribal areas with restricted access requiring government permissions.
Quality Assurance and Data Integrity Protocols
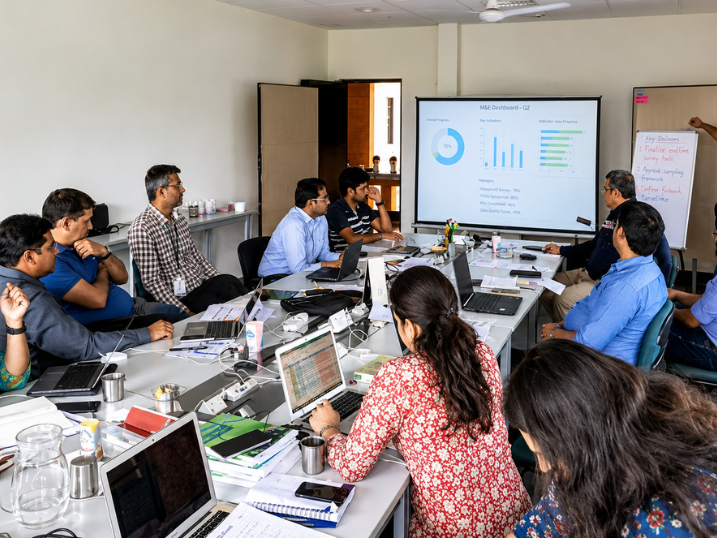
Real-Time Data Monitoring and Back-Checks
CAPI surveys enable real-time data quality monitoring. Research managers monitor incoming data daily, reviewing survey duration patterns, GPS coordinates, item non-response rates, and response distributions. Field supervisors conduct back-checks—abbreviated follow-up surveys with a sample of respondents—within 48 to 72 hours of original interviews, verifying key demographic and substantive data. Audio audits provide additional verification through random recording of survey sections with respondent consent.
Survey Pilot Testing and Ethical Standards
Before full fieldwork deployment, every survey instrument undergoes pilot testing with respondents matching target population characteristics, including cognitive interviews that reveal interpretation problems not evident from response distributions alone.
All research protocols undergo ethical review aligned with international standards. We maintain an internal ethics review process and collaborate with institutional review boards at partner universities when required. Ethics protocols address informed consent procedures with illiterate populations, assent processes for minor participants, confidentiality protections for sensitive topics, and voluntary participation and right to withdraw. Data security protocols include encryption of digital data, password-protected access with role-based permissions, and secure servers meeting data protection standards.
Partnership Model for Donors and Implementing Organizations
Collaborative Survey Design and Timeline Transparency
We engage clients in collaborative survey design rather than accepting predetermined instruments without technical input, beginning with scoping consultations clarifying research objectives and program theory of change. Joint instrument development includes reviewing validated measurement tools, adapting questions to local context and language, and balancing comprehensiveness with respondent burden.
We provide realistic timeline estimates spanning protocol development, enumerator training, pilot testing, full fieldwork implementation, data cleaning and validation, and final dataset delivery. Budget development includes transparent per-interview costs, supervision and quality assurance expenses, travel and logistics for remote areas, technology platform fees, and data processing costs.
Data Deliverables
Standard data deliverables include cleaned datasets in Stata, SPSS, or CSV formats with labeled variables and value labels, comprehensive codebooks documenting all variables, response categories, and skip patterns, survey instruments in English and all field languages, sampling methodology documentation, and data quality reports covering response rates and enumerator performance.
Our data collection integrates with client M&E frameworks by aligning survey timing with program reporting deadlines and incorporating standard indicators from log frames and results frameworks.
Why Development Organizations Choose Outline India
Scale, Speed, and Methodological Rigor
We mobilize fieldwork rapidly when program timelines require quick turnaround. Simultaneously, we manage large-scale projects across multiple districts and states, coordinating enumerator teams while maintaining data quality.
Our research team includes survey methodologists, economists, and social scientists who maintain research standards in development sector projects, ensuring appropriate sampling designs, validated measurement tools, and analytic approaches meeting academic and donor evaluation standards.
Sector Expertise and Track Record
Years of concentration in development sector research builds substantive expertise beyond generic survey implementation. Our teams understand education measurement, health surveys (anthropometric measurement, illness recall modules), livelihoods research (income estimation, time use surveys), and WASH studies. This expertise prevents common errors like inappropriate income questions in informal economies or problematic self-reported health measures where observational data improves validity.
Our client base includes foundation clients, bilateral and multilateral donors, government agencies, and international NGOs. While we maintain client confidentiality and do not publicly list all partnerships, our work has contributed to evaluation reports and program assessments across sectors and geographies.
---
Partner With Us for Your Data Collection Requirements
Development programs deserve primary data collection that meets the methodological standards your evaluation designs require and the operational reliability your program timelines demand. Whether you are designing a multi-state impact evaluation, implementing ongoing monitoring for adaptive management, or conducting formative research to inform program design, Outline India provides the field infrastructure, technical capacity, and development sector experience to deliver credible data on schedule.