About
OI Deck
Team, Fellows
Field Team
Solutions
What we do
Our Work
Our Network
Clients and Accolades
Resources
Reports
Blogs
infographics
OI research papers
Cautionary Tales
Newsletters
OI Data conscious badge Highlights
Policies
Our Policies
Data Quality and Ethics
Media
Publications
Gallery
Videos
Career
Current openings
Work Culture
Interns Spotlight
Contact
Want a survey - RV form
Get in touch
Infographics
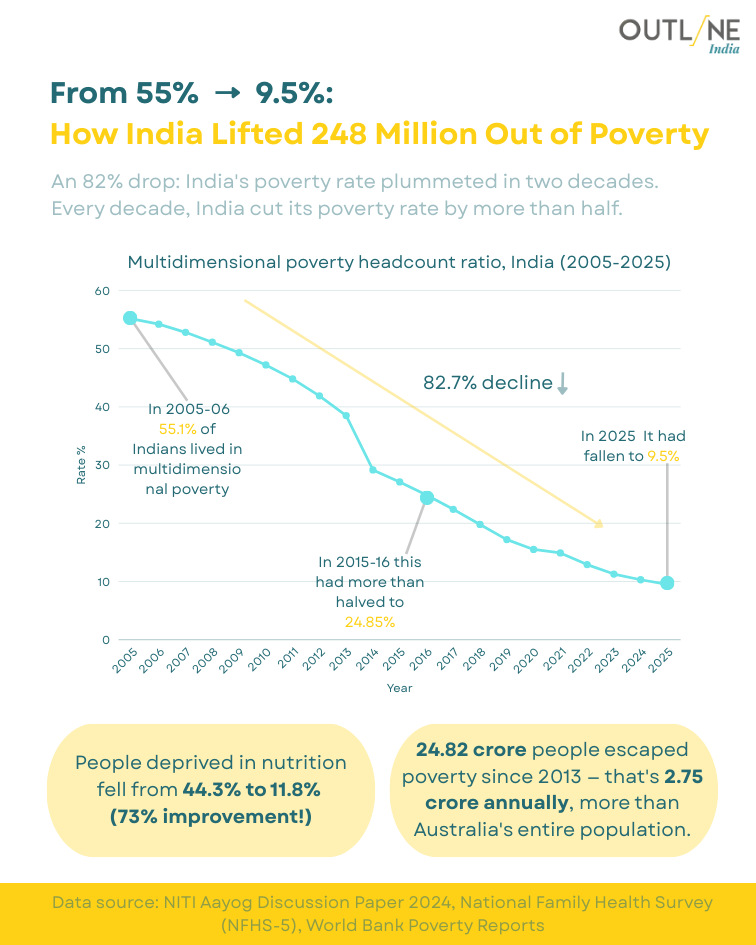
From 55% to 9.5% — We Counted the Exits, Rarely Asked About the DoorsIndia's multidimensional poverty headcount has fallen from 55.1% in 2005–06 to 9.5% by 2025 — an 82.7% decline that is, by any measure, a remarkable achievement. Some 24.82 crore people have escaped poverty since 2013, roughly 2.75 crore annually. People deprived in nutrition fell from 44.3% to 11.8% — a 73% improvement. Yet multidimensional poverty indices measure deprivation across indicators, not the depth of it; a household that gains a toilet and a cooking fuel cylinder moves off the poverty count, even if it earns ₹400 a day. The decline is real. Whether it is durable — or a statistical exit from a threshold rather than a structural exit from precarity — is a question the headline does not invite.
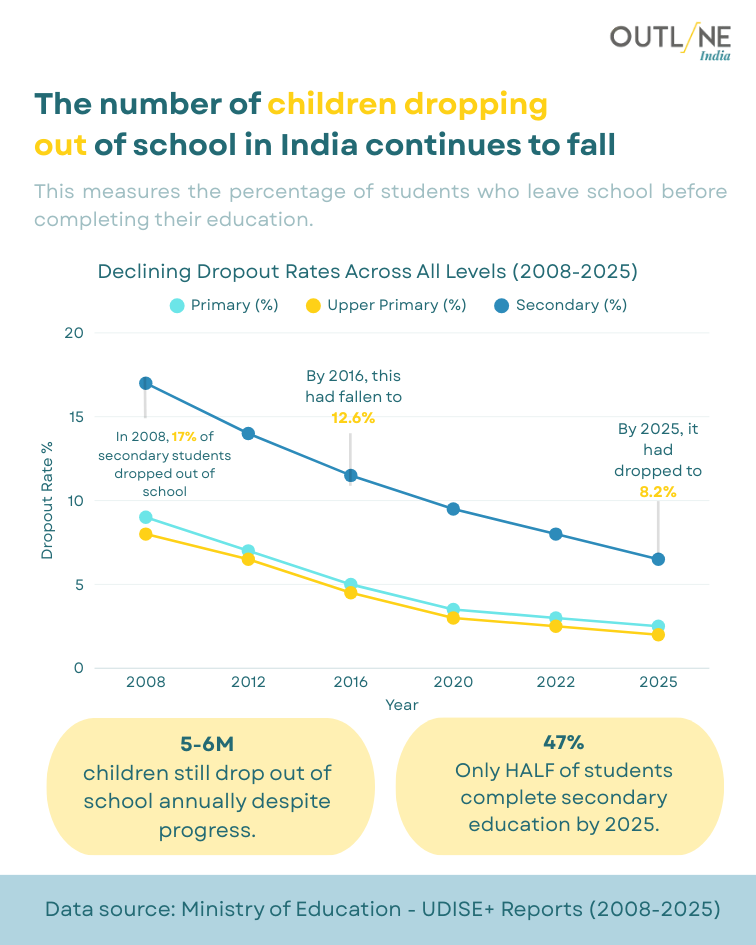
The Dropout Rate Fell — Half the Country Still Doesn't Finish School, But Do Go OnIndia's secondary school dropout rate has declined from 17% in 2008 to 8.2% by 2025 — a number worth celebrating, until you notice that only half of all students complete secondary education. Five to six million children still leave school annually despite nearly two decades of progress. The graph trends downward; the bottom of it remains a ledge, not a floor. A country that cannot retain half its children through Class 10 and calls the other half's persistence a revolution has defined success generously.
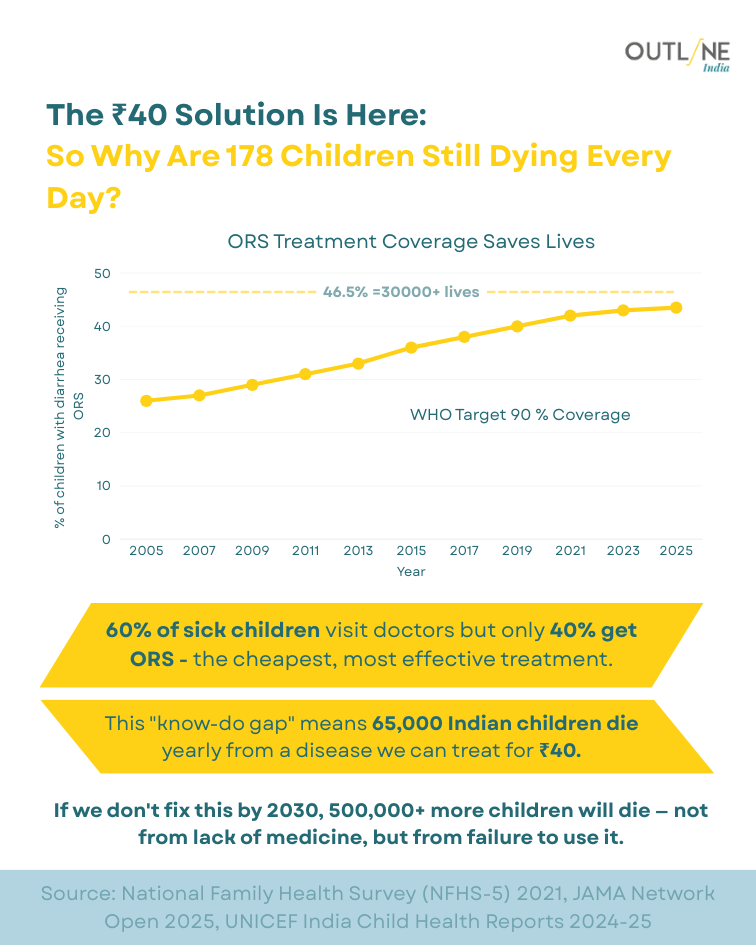
A ₹40 Sachet, 65,000 Dead Children, and the Gap Between Knowing and DoingIndia has a solution to childhood diarrhoea deaths — it costs ₹40, it works, and 60% of sick children are already reaching doctors. Only 40% of them actually receive ORS. That gap — not a gap in medicine, not a gap in infrastructure, but a gap between a prescription and its administration — kills an estimated 65,000 Indian children every year. ORS treatment coverage has risen to 46.5%, saving over 30,000 lives, but the WHO target is 90%. If coverage stays where it is through 2030, the infographic projects 500,000 additional preventable deaths. We have the cure. We have not yet committed to using it.
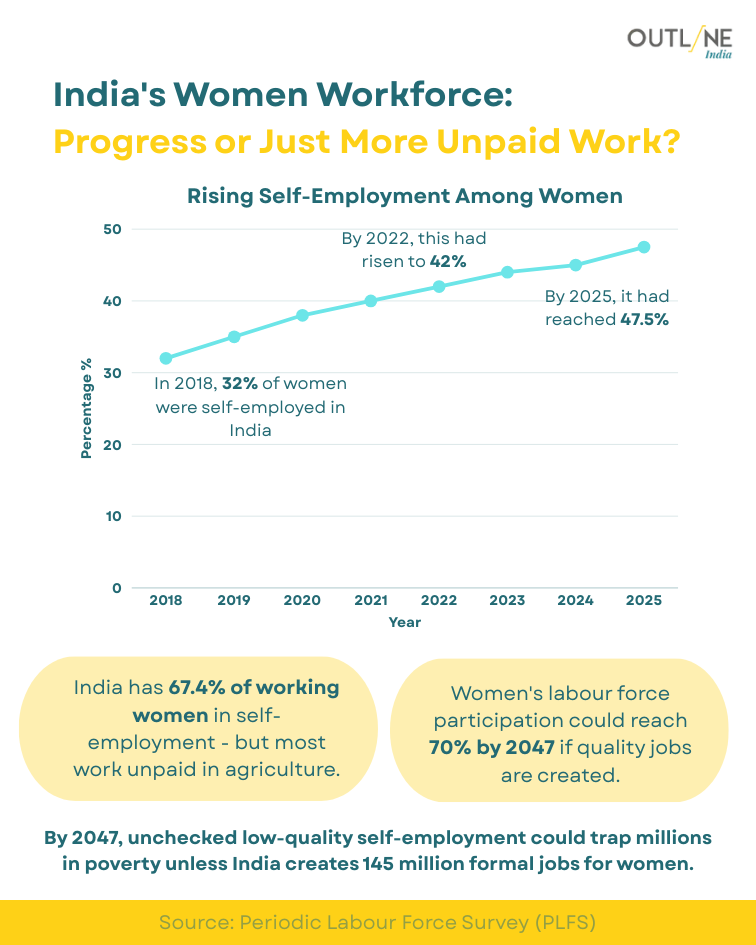
Self-Employed, Unpaid, and Counted as Progress — India's Women Workforce Story Women's self-employment in India has risen from 32% in 2018 to 47.5% by 2025 — a trend the data presents as progress and the fine print quietly undermines. Of working women, 67.4% are self-employed, but most of this work is unpaid, agriculture-based, and informal. Women's labour force participation could reach 70% by 2047, the infographic notes — if quality jobs are created. That conditional clause carries the weight of the entire argument. Without 145 million formal jobs for women by 2047, the self-employment surge is not economic inclusion; it is the formalisation of subsistence.
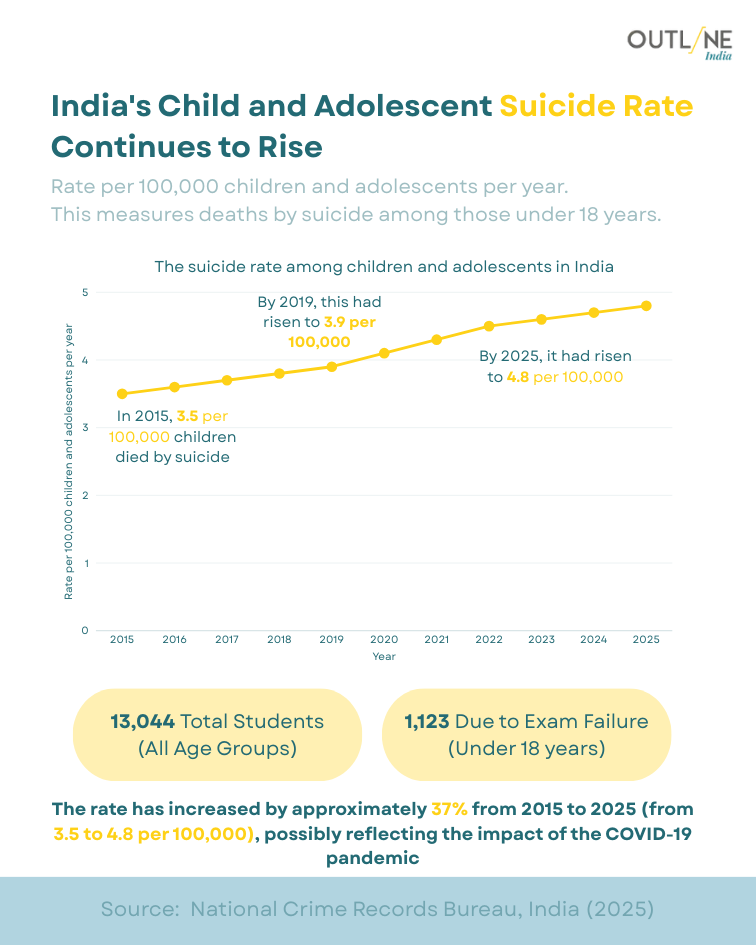
The Exams Got Harder, the Safety Nets Didn't — India's Children Are Not Alright India's child and adolescent suicide rate has risen from 3.5 per 100,000 in 2015 to 4.8 per 100,000 by 2025 — a 37% increase over a decade. Of 13,044 total student suicides across all age groups, 1,123 were attributed to exam failure among those under 18. The COVID-19 pandemic accelerated what was already a trend; the recovery did not reverse it. A society that measures its educational success by declining dropout rates and rising enrolment figures while its children die from the pressure of what happens after they stay enrolled has not yet asked the right question.
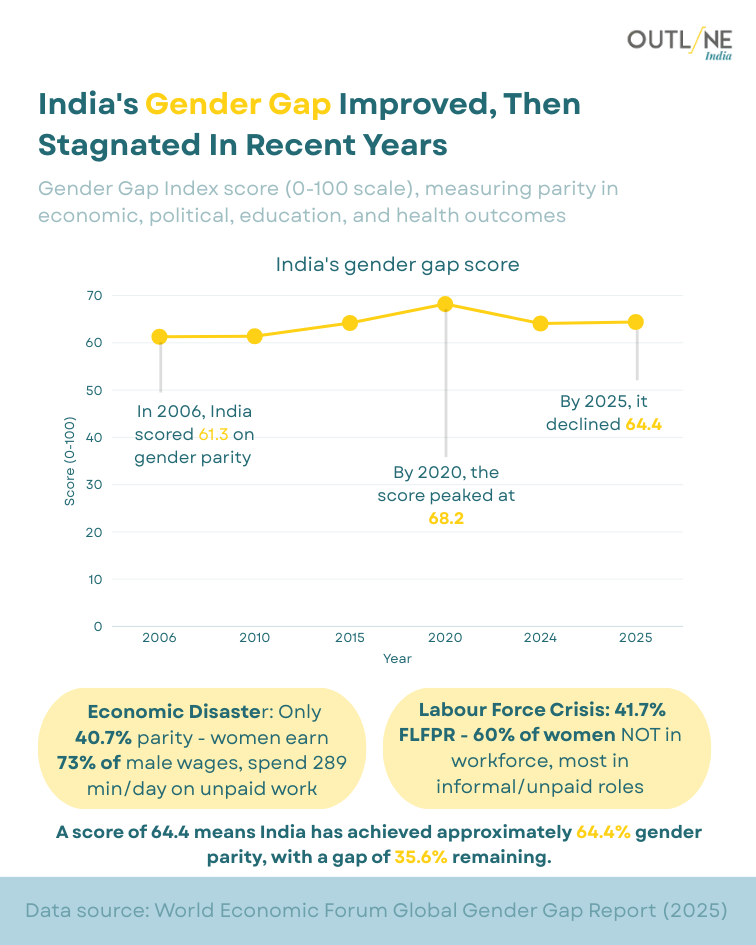
64.4 Out of 100 — India's Gender Parity Score Has a Long Memory and a Short Ambition India's Gender Gap Index score peaked at 68.2 in 2020 and has since declined to 64.4 by 2025 — meaning India has achieved roughly two-thirds of gender parity and appears comfortable resting there. Women earn 73% of male wages, spend 289 minutes a day on unpaid work, and constitute only 40.7% of economic parity. With 41.7% Female Labour Force Participation — and 60% of those women in informal or unpaid roles — the score is not a ceiling being approached; it is a number being maintained. A 35.6% gender gap remaining in 2025 is not a work-in-progress. It is a policy choice.
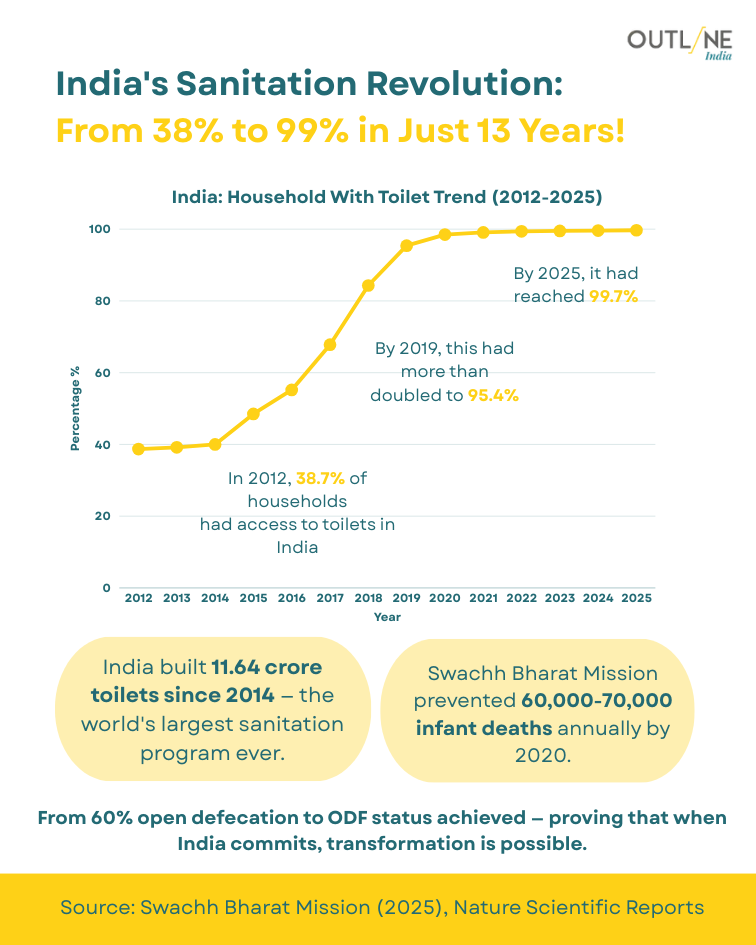
We Built the Toilets. The Question We Didn't Ask Was Whether They Were Being Used India built 11.64 crore toilets since 2014, took household toilet access from 38.7% in 2012 to 99.7% by 2025, and declared itself Open Defecation Free. Swachh Bharat Mission is credited with preventing 60,000–70,000 infant deaths annually by 2020. These are significant achievements. What the infographic does not show — and what field researchers and NFHS data have repeatedly flagged — is the gap between toilet construction and toilet use, between ODF declaration and sustained behaviour change. Infrastructure without sanitation norms is a number. Whether 99.7% of households now safely dispose of waste is a different question from whether they possess a structure classified as a toilet.
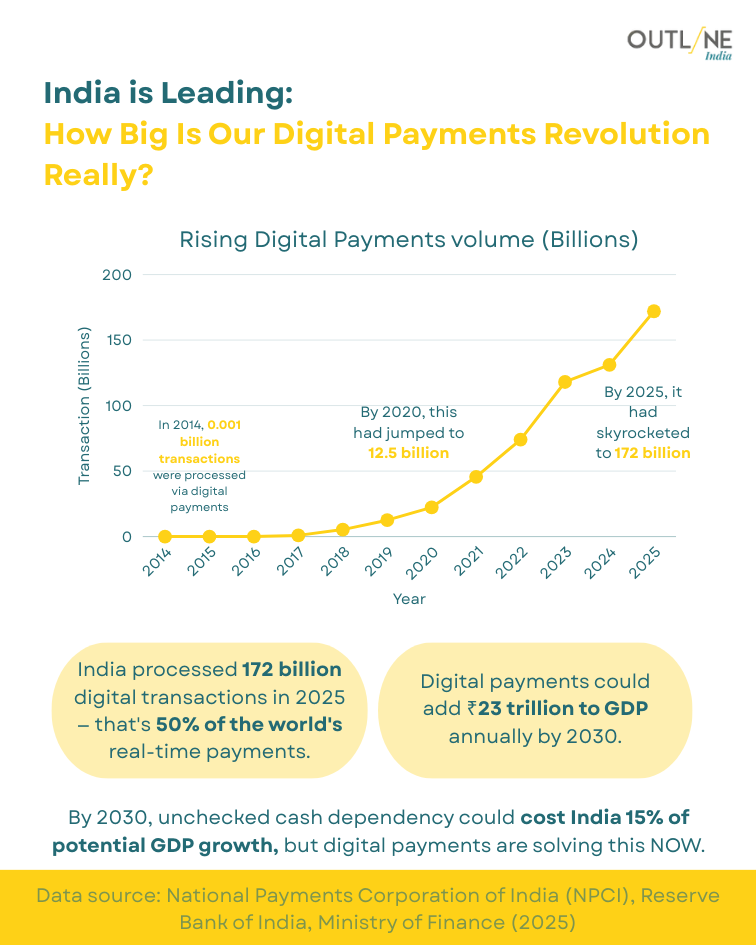
172 Billion Transactions, 50% of Global Real-Time Payments — and the 300 Million Who Aren't Counted India processed 172 billion digital transactions in 2025, up from 0.001 billion in 2014 — a rise so steep the graph looks like a policy ambition rendered as fact. India now accounts for 50% of the world's real-time payments. Digital payments could add ₹23 trillion to GDP annually by 2030. What the chart does not show is the distribution: who is transacting, how often, and whether the hundreds of millions in low-literacy, low-connectivity, low-smartphone rural India are participants in this revolution or its audience. A payment infrastructure built for the connected is not the same as one built for all.
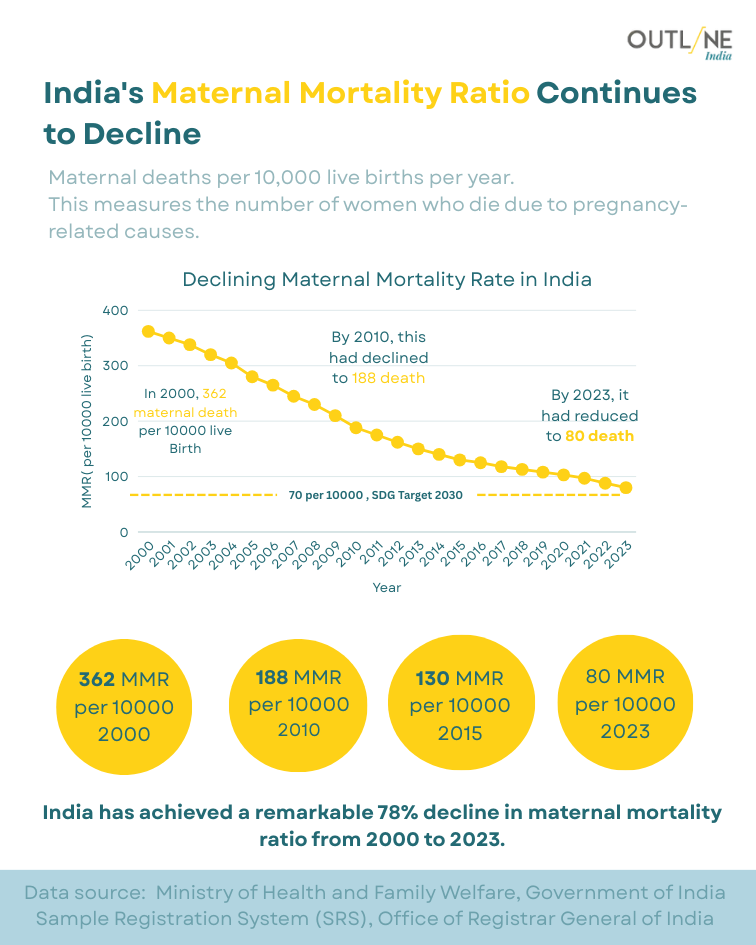
From 362 to 80 — India's Maternal Mortality Decline Is Real and Still Not Enough India's Maternal Mortality Ratio has fallen from 362 per 10,000 live births in 2000 to 80 by 2023 — a 78% decline that is among the steeper improvements in the region. The SDG 2030 target, however, is 70 per 10,000, and the pace of decline has slowed in recent years. The progress has been uneven across states, with high-burden states like Uttar Pradesh, Rajasthan, and Madhya Pradesh pulling aggregate numbers while southern states long achieved near-target levels. A national average of 80 is both a milestone and a statistical softening of a more unequal story hidden beneath it.
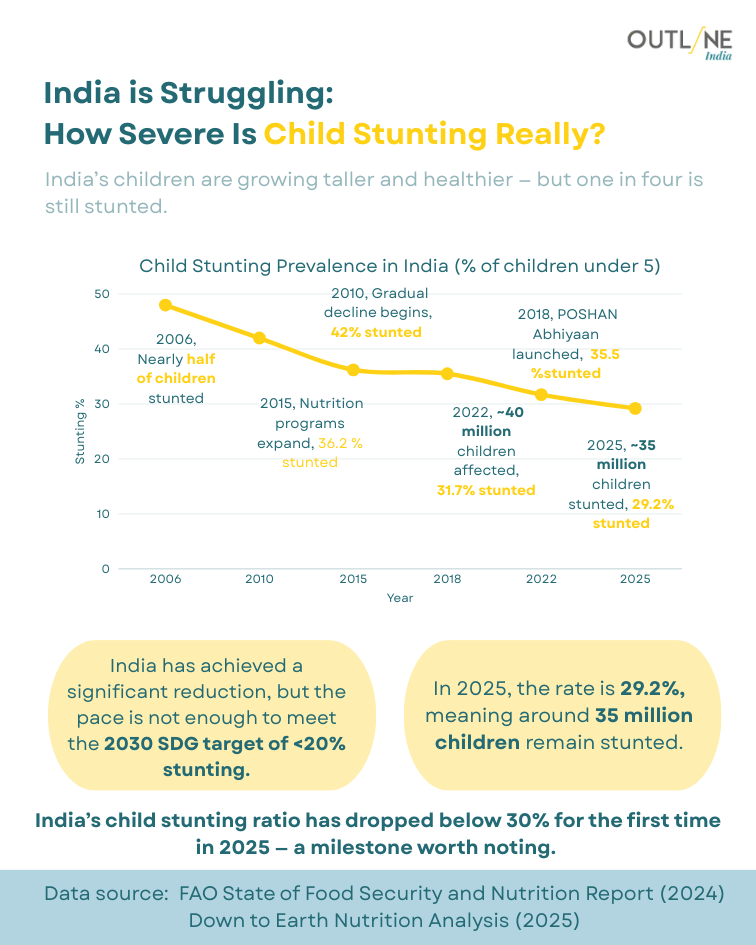
35 Million Children Are Still Stunted — But the Programme Has a New Name, So That Helps India's child stunting rate has declined from nearly 50% in 2006 to 29.2% by 2025 — below 30% for the first time, which the infographic marks as a milestone. Around 35 million children remain stunted. The 2030 SDG target is under 20%, and the current pace of decline does not reach it. POSHAN Abhiyaan was launched in 2018 with the stunting rate at 35.5%; seven years later it stands at 29.2%. The decline is real; it is also approximately 3 percentage points per three years in a country where adequate nutrition infrastructure has been chronically underfunded. The milestone is real. The distance remaining is larger.
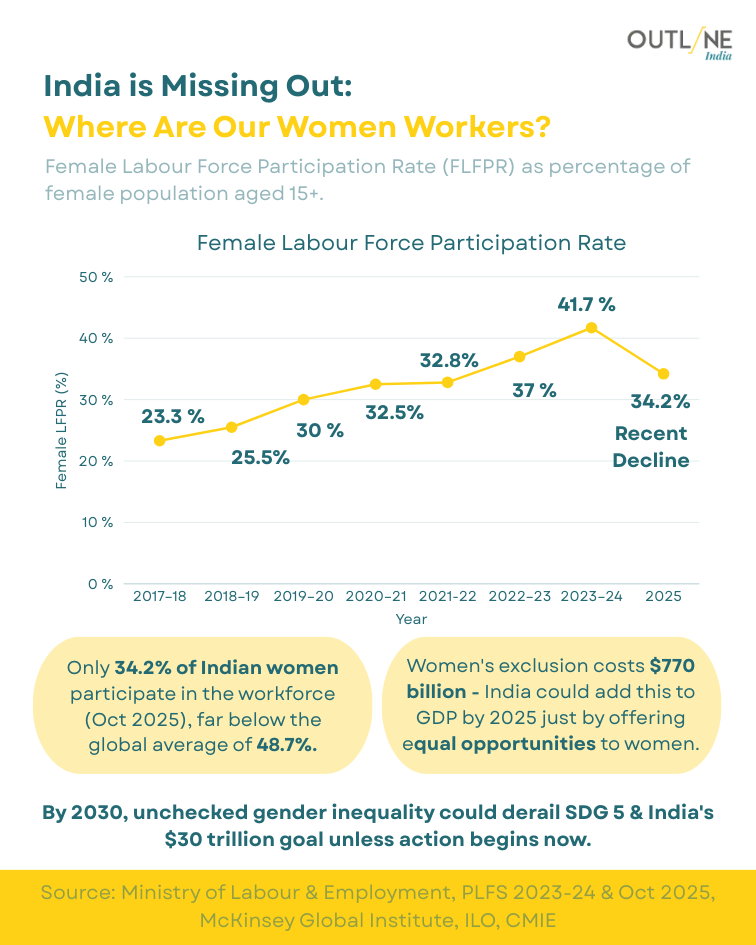
41.7% and Falling — India's Women Peaked in the Workforce and Then Were Shown the Door India's Female Labour Force Participation Rate climbed from 23.3% in 2017–18 to a high of 41.7% in 2023–24 — then declined to 34.2% by October 2025, still well below the global average of 48.7%. Women's exclusion from the workforce is estimated to cost India $770 billion in foregone GDP. Of those women who do participate, the majority are in informal, low-wage, or unpaid roles. The graph shows a peak and a fall. The infographic does not ask what drove women out — whether it was marriage, caregiving load, lack of safe transport, or simply the absence of jobs that were actually designed for them.
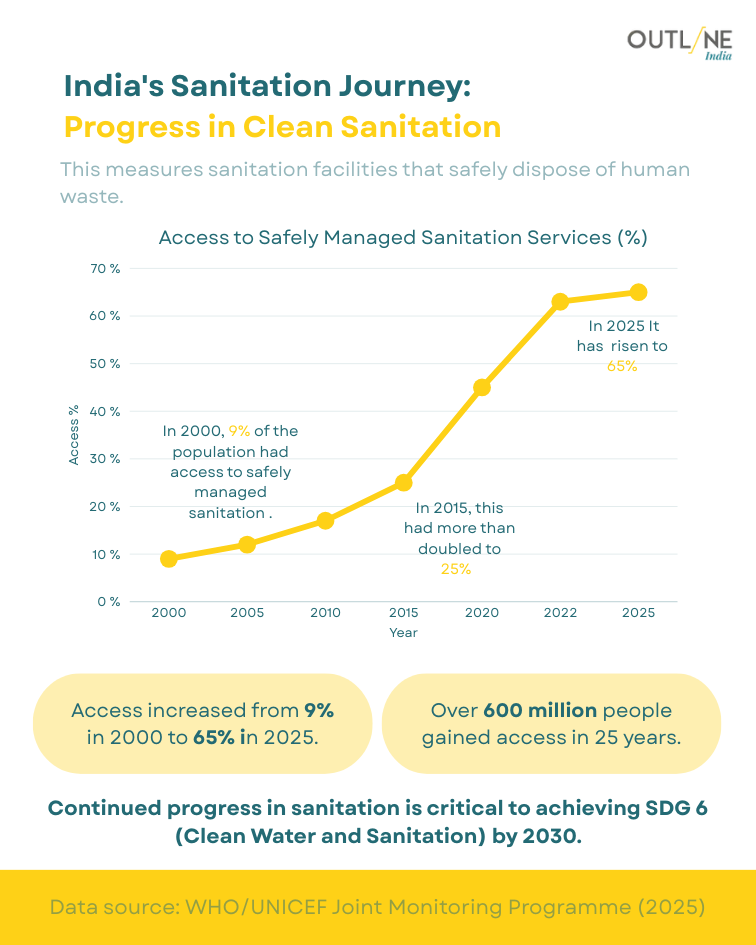
From 9% to 65% — A Quarter-Century of Progress That Left 35% Behind Access to safely managed sanitation services — facilities that dispose of human waste without contaminating the environment — has risen from 9% of India's population in 2000 to 65% by 2025. Over 600 million people gained access over 25 years. The SDG 6 target for 2030 is universal coverage. At the current pace, 35% of India's population — roughly 500 million people — remains outside safe sanitation access with five years to the deadline. The toilet construction headline and the safely managed sanitation headline are different numbers, measuring different realities, and it matters which one we choose to celebrate.
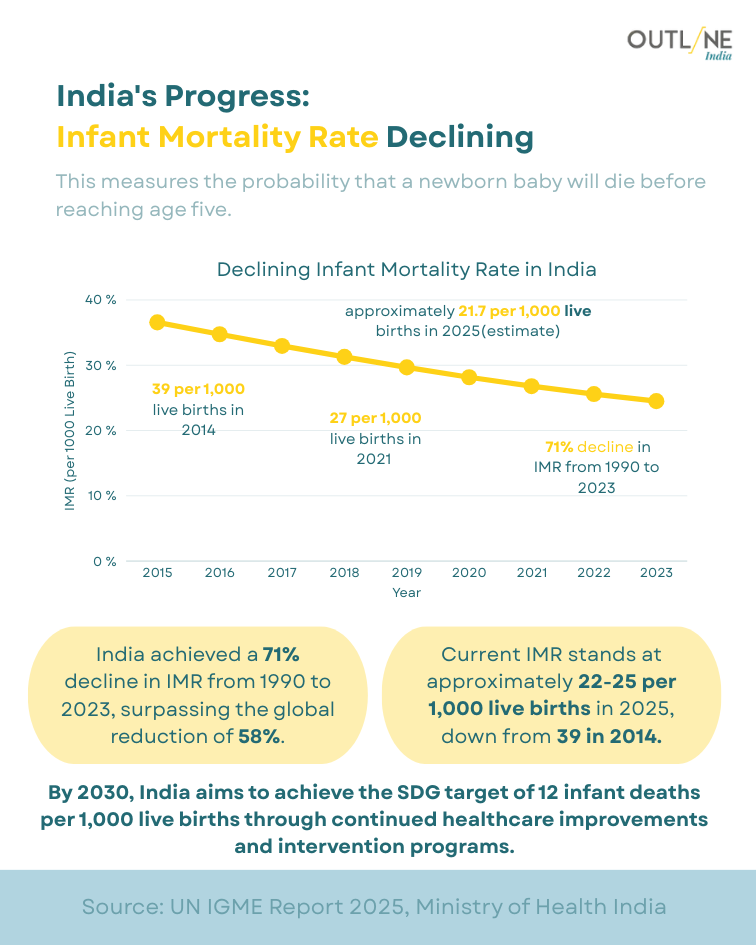
From 39 to 22 Per Thousand — India Outpaced the World, But the Last Mile Is a Long Road India achieved a 71% decline in its Infant Mortality Rate from 1990 to 2023, surpassing the global average reduction of 58%. By 2025, the IMR stands at approximately 22–25 per 1,000 live births, down from 39 in 2014. The SDG target for 2030 is 12 per 1,000. From 22 to 12 in five years requires a faster rate of decline than India has achieved in any comparable period — and the deaths that remain are concentrated among the poorest, most remote, and most underserved populations, where marginal returns to intervention are hardest won. The progress is exceptional. The finish line has not moved.
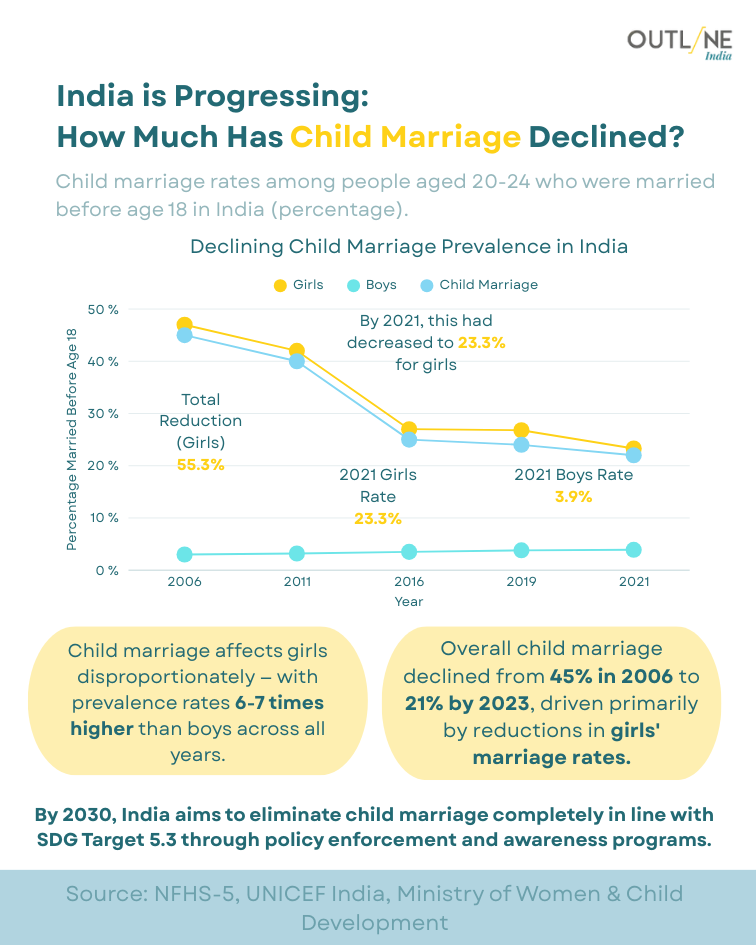
Child Marriage Is Declining — But Girls Are Still Paying a Price Boys Never WillChild marriage prevalence in India declined from 45% in 2006 to 21% by 2023, driven primarily by reductions in girls' marriage rates. Yet girls still experience child marriage at rates 6–7 times higher than boys across all years measured. The total reduction for girls stands at 55.3%. India aims to eliminate child marriage completely by 2030 in line with SDG Target 5.3, through policy enforcement and awareness programmes. The numbers move in the right direction; the gap between boys and girls in who bears the cost of early marriage has barely narrowed. A declining national rate is not the same as a declining gender disparity — and conflating the two lets the harder problem disappear inside the easier headline.
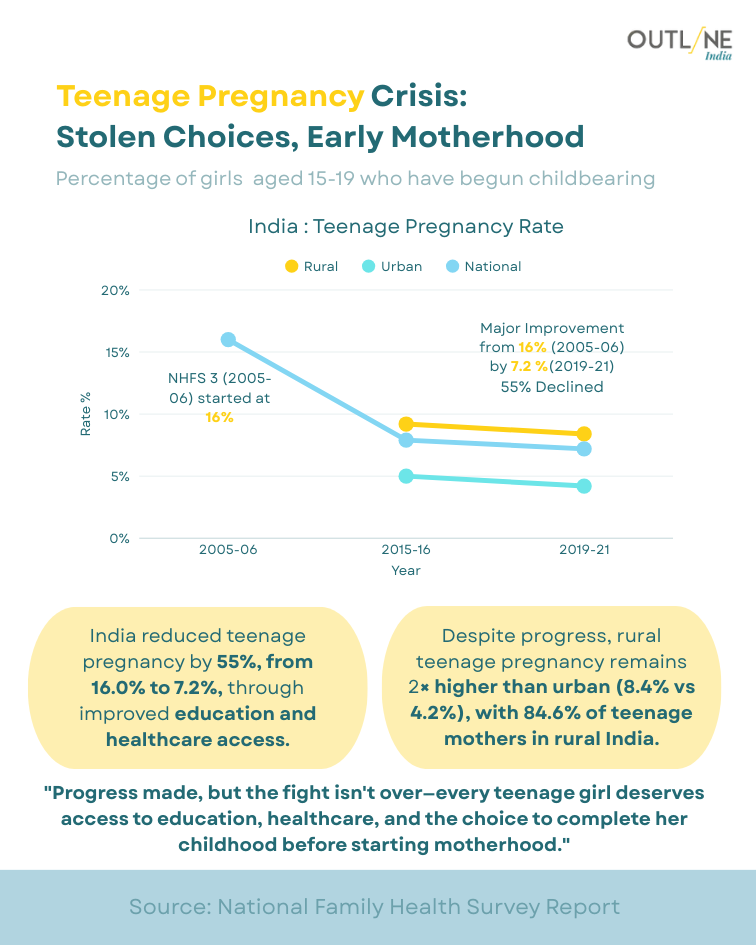
55% Decline, and Rural Girls Are Still Twice as Likely to Become Teenage Mothers India reduced its teenage pregnancy rate by 55% — from 16.0% to 7.2% — through improved education, healthcare access, and policy focus between 2005–06 and 2019–21. The national number is a genuine achievement. Rural teenage pregnancy, however, remains more than twice the urban rate: 8.4% versus 4.2%, with 84.6% of teenage mothers located in rural India. The infographic closes with a quote — "Progress made, but the fight isn't over — every teenage girl deserves to complete her childhood before starting motherhood." It is a sentiment. What it is not is an explanation of why, after two decades of programmes, the girl in the village is still twice as likely to be pregnant before she turns twenty as the girl in the city.
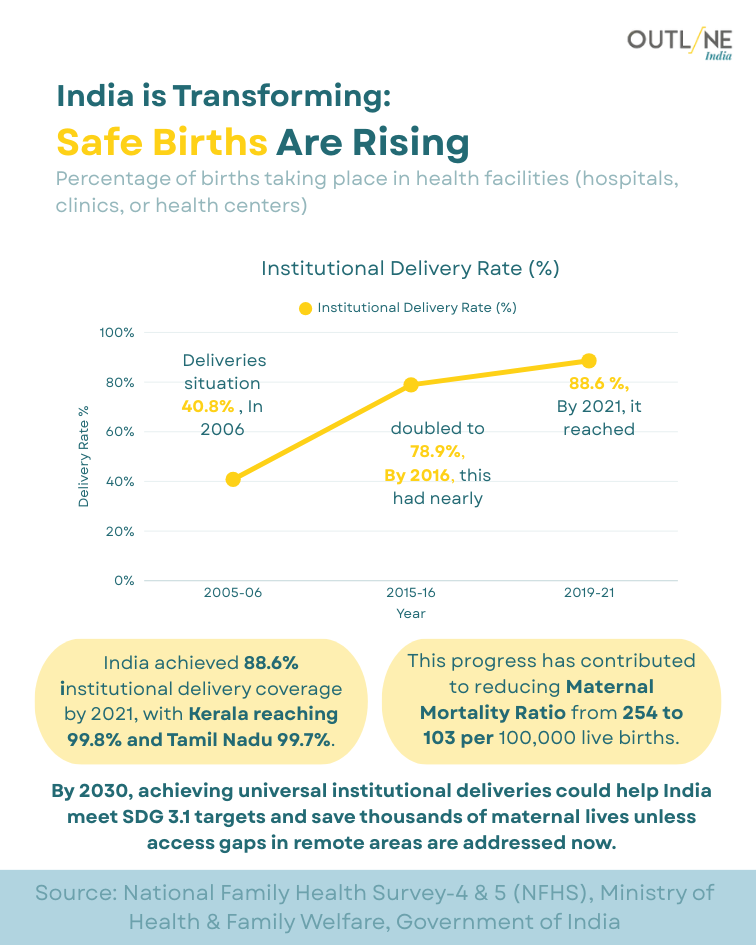
88.6% Delivered in Facilities — the 11.4% Who Aren't Are Disproportionately Rural, Poor, and Uncounted India's institutional delivery rate has risen from 40.8% in 2006 to 88.6% by 2021 — nearly doubling in fifteen years and contributing to a reduction in the Maternal Mortality Ratio from 254 to 103 per 100,000 live births. Kerala has reached 99.8% coverage, Tamil Nadu 99.7%. The SDG 3.1 target requires near-universal institutional deliveries by 2030. What the national average softens is the state-level and district-level variance: the 11.4% of births still occurring outside health facilities are not distributed randomly — they are concentrated in remote areas, among the poorest households, and in states that have historically underinvested in maternal health infrastructure. A facility delivery counts equally in the national figure whether it is a tertiary hospital in Chennai or an understaffed primary health centre in a flood-prone district. The average is reassuring. The distribution is the emergency.
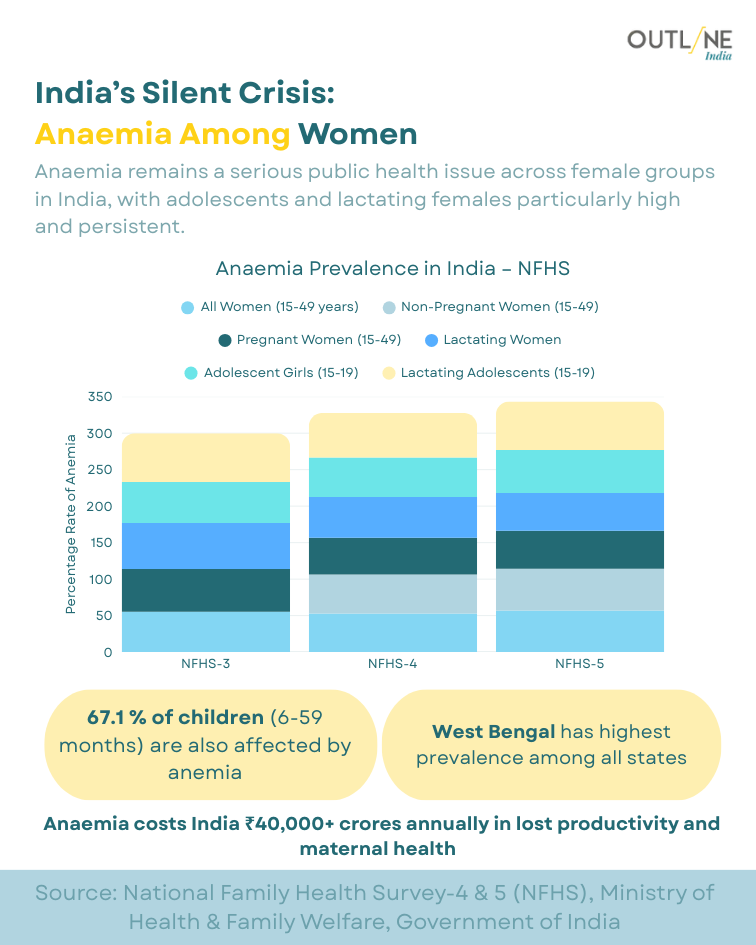
Half of India's Women Are Anaemic — and the Lines Between NFHS-4 and NFHS-5 Barely Moved Anaemia prevalence among all women aged 15–49 stands at 57% in NFHS-5, with lactating women at 63%, pregnant women at 52.2%, and adolescent girls at 59.1%. The line chart comparing NFHS-4 and NFHS-5 shows minimal change across most categories — lactating women actually increased from 64.9% to 66.27%. Some 67.1% of children aged 6–59 months are also affected. Anaemia costs India an estimated ₹40,000 crore annually in lost productivity and maternal health. West Bengal holds the highest state-level prevalence. This is not a gap being discovered — it is one being re-measured, re-documented, and left structurally unchanged between two national surveys spanning nearly a decade.
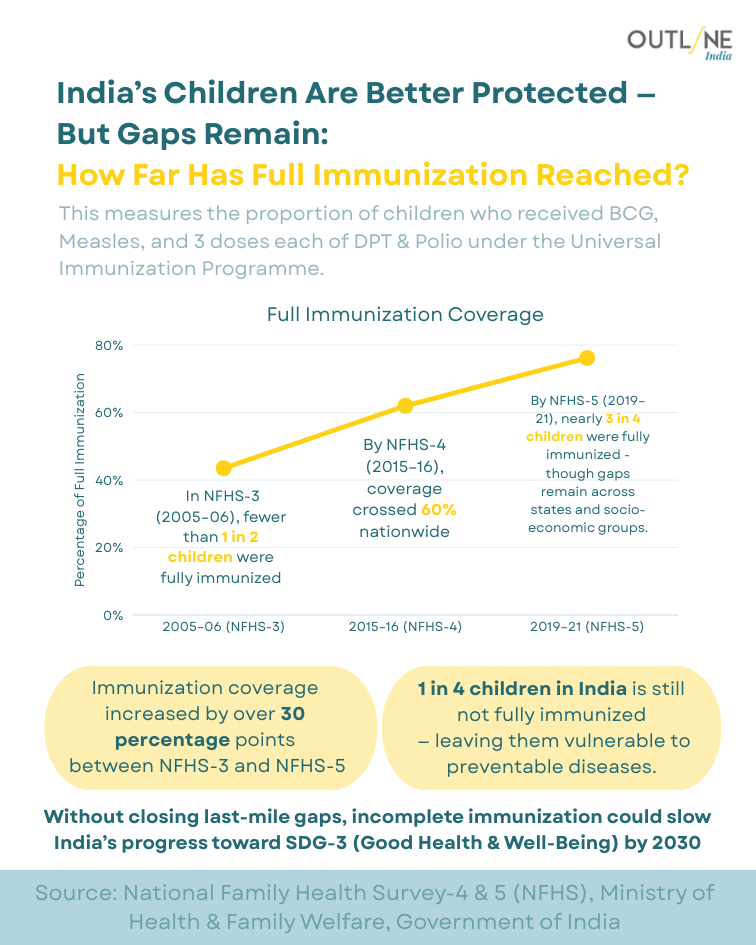
80% Immunised — and the One in Four Left Behind Is Not Randomly Distributed Full immunisation coverage in India rose from fewer than 10% of children in 2005–06 to nearly 80% by NFHS-5 in 2019–21 — a 30 percentage point increase that represents one of India's more consistent public health achievements. One in four children, however, remains not fully immunised, leaving them vulnerable to preventable diseases. The gaps are not random: they persist sharply across states and socioeconomic groups, meaning the unimmunised 20% is concentrated in precisely the communities least equipped to absorb the consequences of preventable illness. Without closing last-mile gaps, incomplete immunisation could slow India's progress toward SDG 3 by 2030. The headline covers 80% of children. The remaining 20% are the policy problem hiding inside the success story.
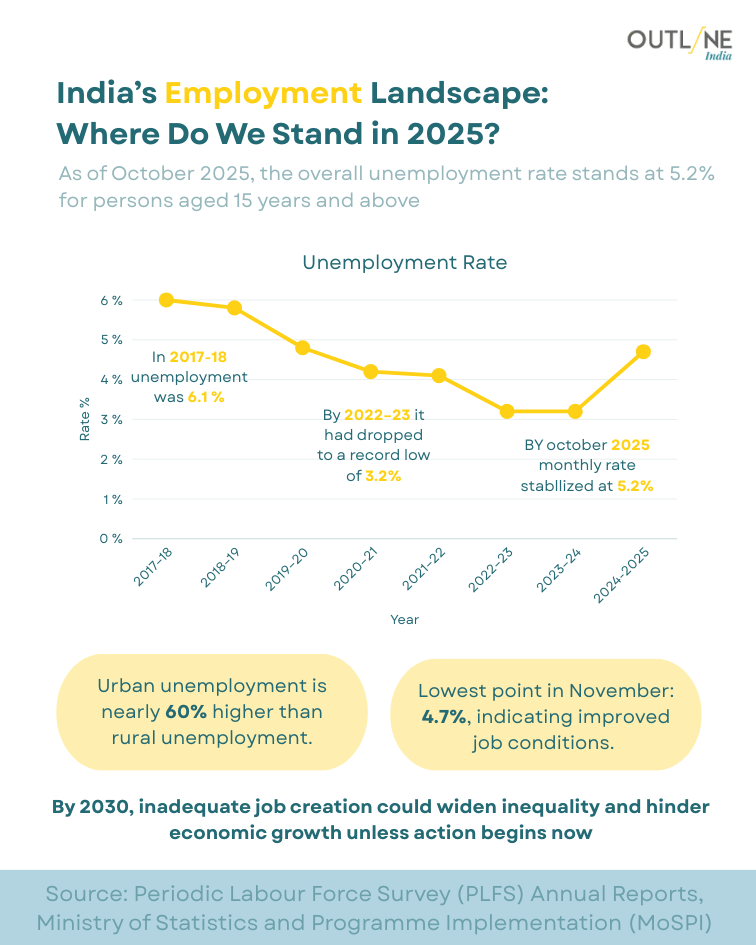
5.2% Unemployment — Urban India Is 60% More Jobless Than Rural, and Growing India's overall unemployment rate stood at 5.2% as of October 2025, down from 6.1% in 2017–18 and touching a record low of 3.3% in 2022–23 before stabilising upward. The lowest point was November at 4.7%, indicating some improvement in job conditions. Urban unemployment, however, runs 60% higher than rural unemployment — a gap the aggregate figure smooths over. By 2030, inadequate job creation risks widening inequality and undermining economic growth. A falling national unemployment rate that masks a deepening urban-rural divide in job quality and availability is less an indicator of recovery and more an average of two very different labour markets being counted as one.
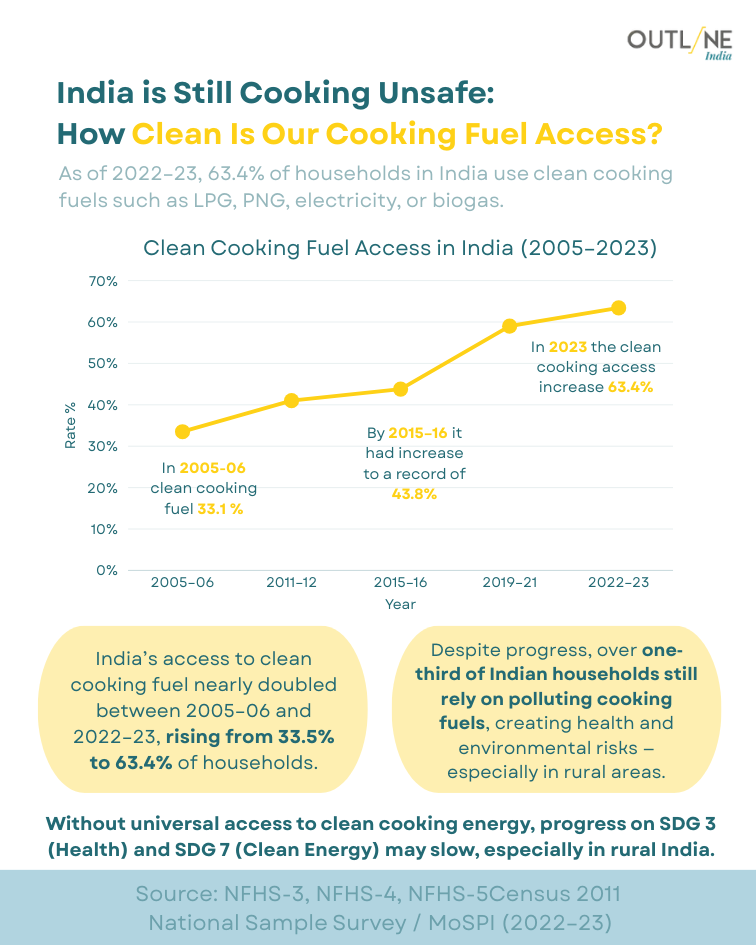
63% Cook Clean — the Other Third Are Still Breathing What They Cook With India's access to clean cooking fuels rose from 33.5% of households in 2005–06 to 63.4% in 2022–23 — nearly doubling over 17 years. The Ujjwala Yojana drove impressive LPG connection numbers; sustained refill rates, particularly among low-income rural households where refill costs exceed daily earnings, tell a more complicated story. Over one-third of Indian households still rely on polluting fuels, generating health and environmental risks concentrated in rural areas. SDG 3 and SDG 7 both require universal clean energy access by 2030. A gas connection issued is an infrastructure achievement. A gas cylinder that sits unused because it cannot be afforded to refill is a different kind of statistic — one that does not appear in this chart.
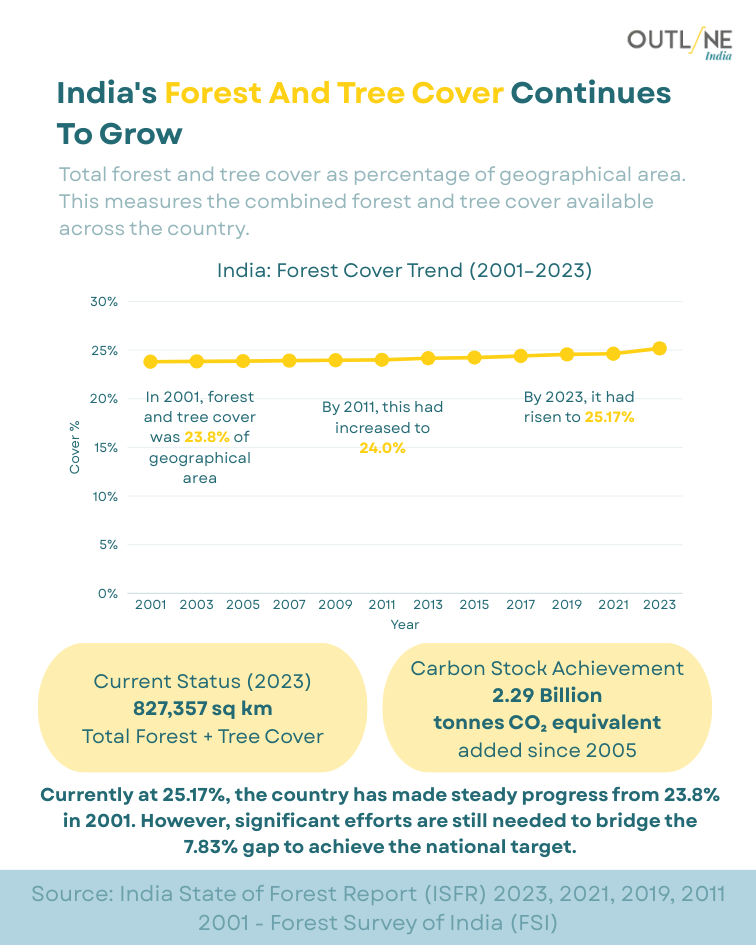
25.17% Forest Cover — Steady Growth, a 7.83% Gap, and Carbon Counted Before Trees Are Lost India's total forest and tree cover has grown from 23.8% of geographical area in 2001 to 25.17% by 2023 — steady, incremental progress over two decades. The current total stands at 827,357 sq km, with a Carbon Stock Achievement of 2.29 billion tonnes CO₂ equivalent added since 2005. The national target remains unspecified at a precise figure, but significant efforts are still needed to bridge the 7.83% gap to it. What the trend line does not show is the quality of that cover — whether it represents dense, biodiverse primary forest or plantation monocultures counted in the same column. A percentage of geographical area covered is not the same as an ecosystem restored.
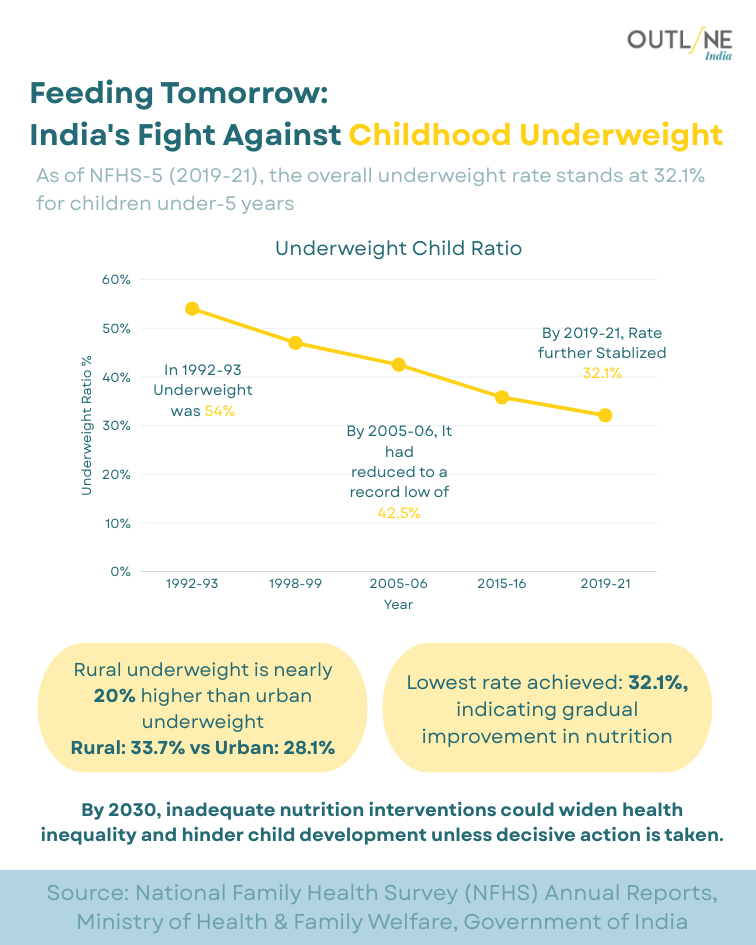
32.1% Underweight — the Lowest Ever, and Still One in Three Children India's childhood underweight ratio stood at 32.1% in 2019–21 — the lowest recorded since measurement began in 1992–93, when it stood at 60%. Progress is real and sustained. Rural underweight, however, remains nearly 20% higher than urban: 33.7% versus 28.1%. By 2030, inadequate nutrition intervention risks widening inequality and slowing child development outcomes across the country. One in three children under five being underweight — in a country simultaneously celebrating GDP growth, digital infrastructure, and poverty reduction — is the kind of figure that demands to be held alongside the celebrations, not after them.
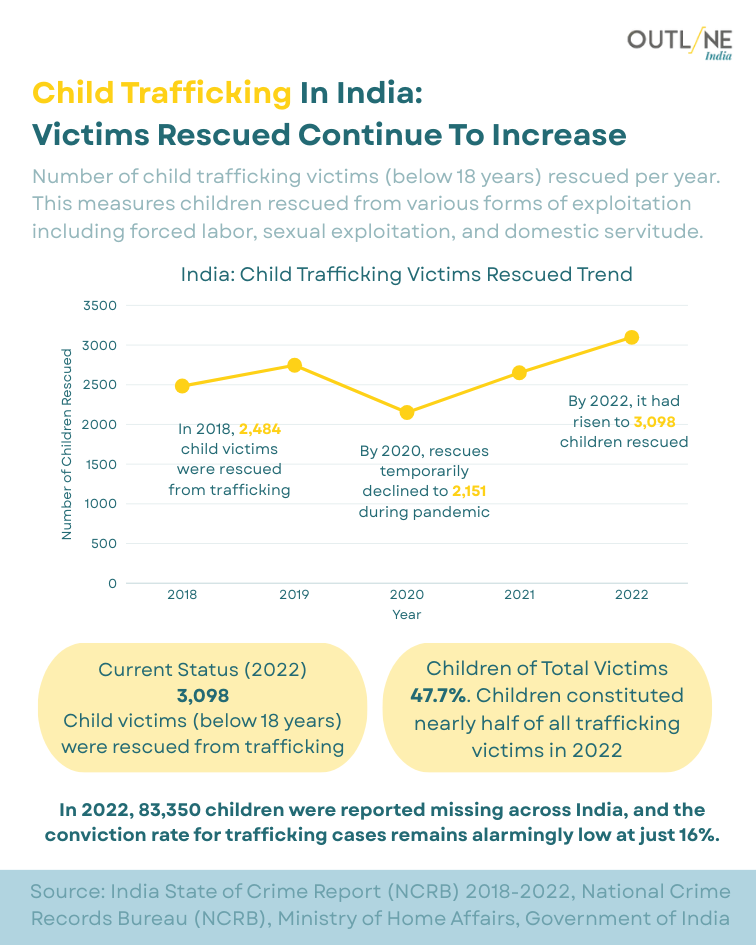
3,098 Children Rescued, 83,350 Missing, and a 16% Conviction Rate — Justice Is Also a Policy Choice In 2022, 3,098 child victims below 18 years were rescued from trafficking in India — constituting 47.7% of all trafficking victims that year. In the same year, 83,350 children were reported missing across the country. The conviction rate for trafficking cases stands at just 16% — meaning eight in ten cases that reach the system do not result in accountability. Children constitute nearly half of all trafficking victims, and the number rescued has been rising since 2018. What has not risen at a comparable pace is the probability that the person who trafficked them will be convicted. Rescue without justice is a partial intervention. At 16%, it is barely that.
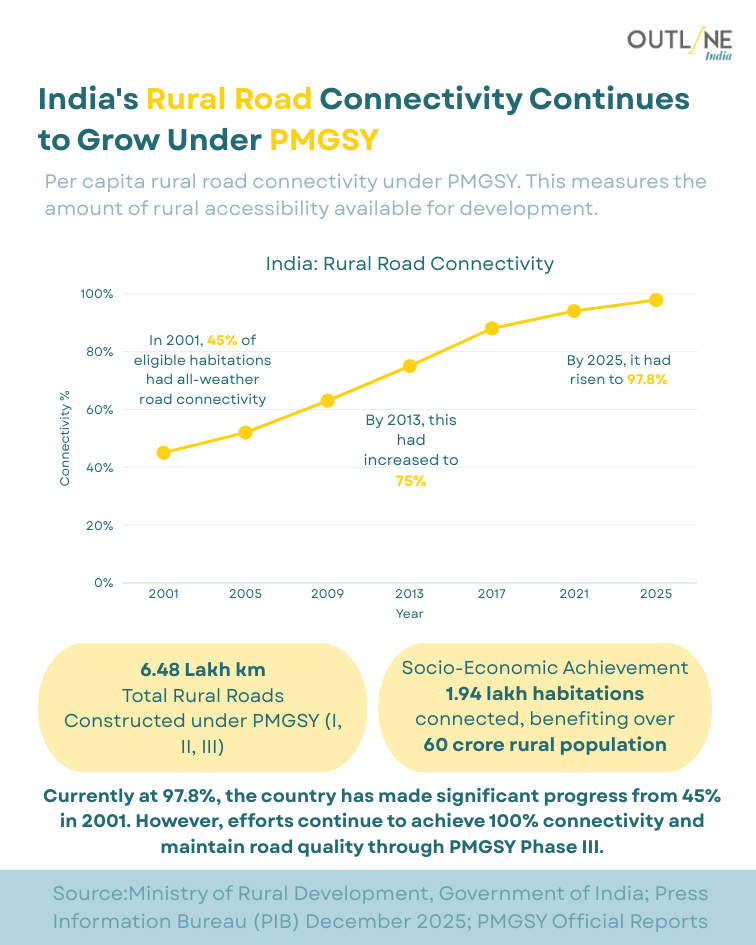
RURAL ROAD CONNECTIVITY (PMGSY) 97.8% Connected on Paper — the Last 2.2% Is Where the Roads Run Out and the Villages Begin India's rural road connectivity under PMGSY has risen from 45% of eligible habitations having all-weather road connectivity in 2001 to 97.8% by 2025 — 6.48 lakh km of total rural roads constructed across three phases. Some 1.94 lakh habitations have been connected, benefiting over 60 crore rural population. The remaining 2.2% are not a rounding error; they are the most remote, most topographically difficult, and most politically invisible habitations in the country. Phase III efforts continue toward 100% connectivity and road quality maintenance. A road that reaches 97.8% of the population and stops is not a completed infrastructure project — it is a completed infrastructure project for everyone the project was easy to reach.
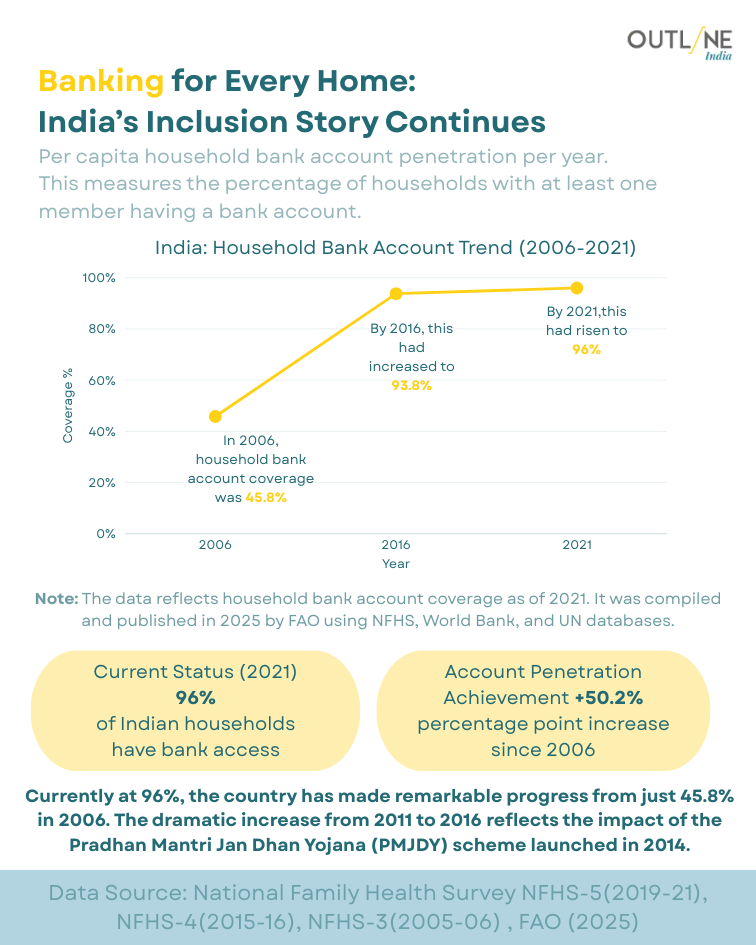
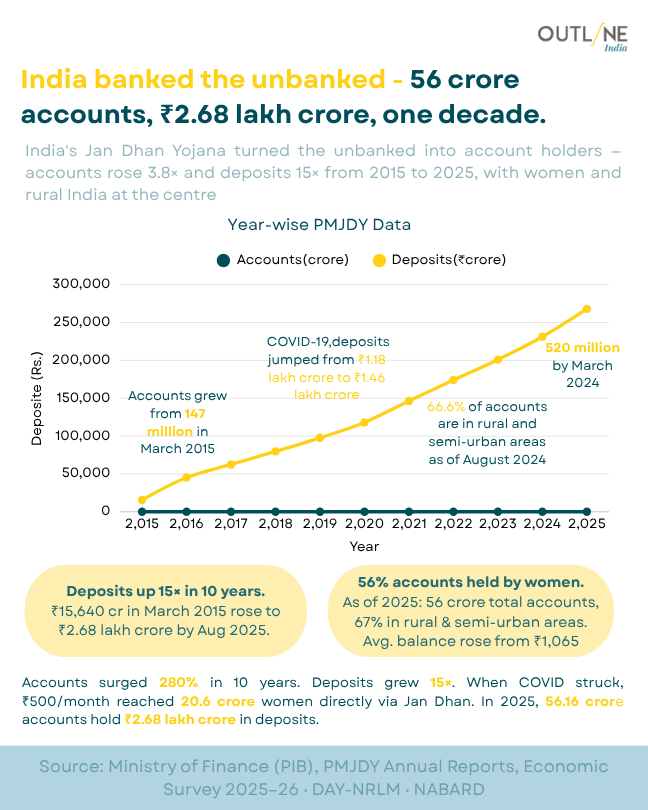
96% Have a Bank Account — the Question Is Whether the Account Has Any Money In It Household bank account coverage in India has risen from 45.8% in 2006 to 96% by 2021 — a 50.2 percentage point increase driven significantly by the Pradhan Mantri Jan Dhan Yojana launched in 2014. The dramatic uptick from 2014 to 2016 reflects the PMJDY's mass account opening campaign. Financial inclusion measured by account ownership and financial inclusion measured by active account use, regular deposits, and credit access are different indicators. A bank account opened under a government scheme and a bank account through which a household meaningfully manages its finances are not always the same object. The 96% figure is an infrastructure achievement. Whether it translates into economic agency is a question this chart does not pose.
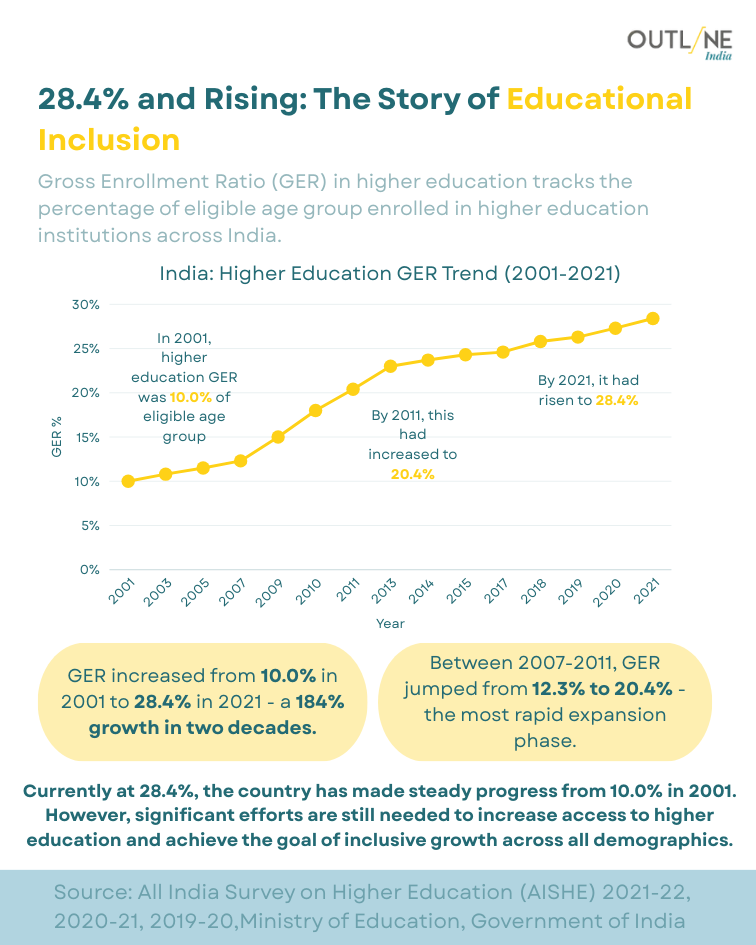
28.4% Enrolled in Higher Education — 71.6% Are Not, and That Is the Bigger Story India's Gross Enrolment Ratio in higher education has risen from 10% in 2001 to 28.4% by 2021 — a 184% increase over two decades, with the most rapid expansion occurring between 2007 and 2011. Significant efforts are still needed to increase access and achieve inclusive growth across all demographics. A GER of 28.4% means that fewer than three in ten eligible young people are enrolled in any higher education institution in India. The gap is not evenly distributed: it falls disproportionately on women, rural youth, first-generation learners, and students from lower-income households. The number rising from 10% to 28.4% is progress. The 71.6% outside it is the policy agenda the progress has not yet reached.
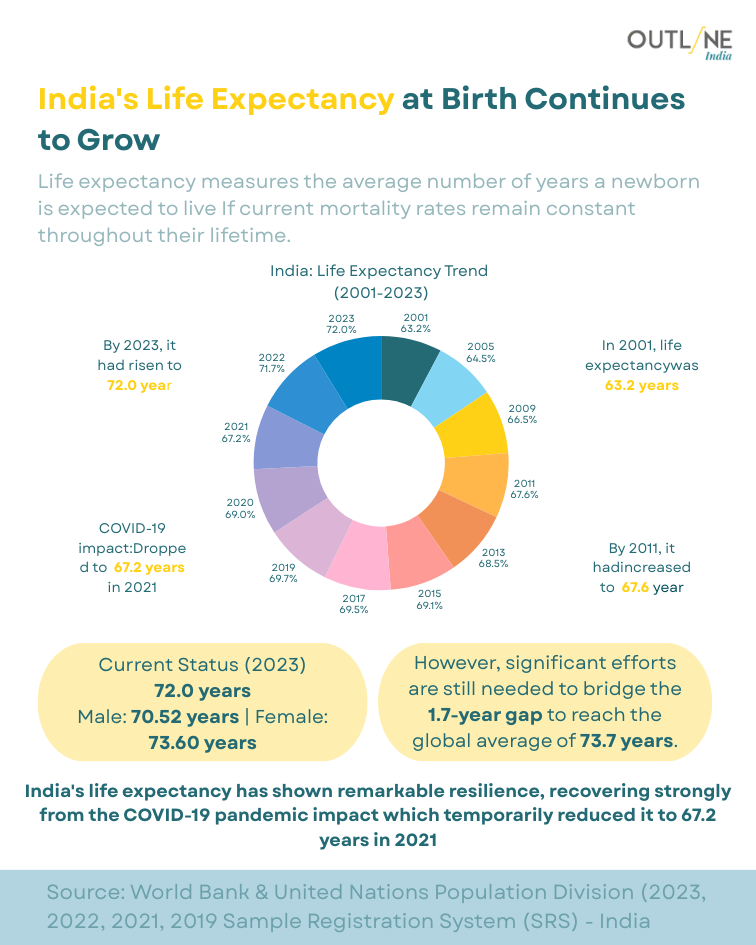
67.2 in 2021, 72 in 2023 — COVID Revealed How Quickly Decades of Progress Can Be Undone The detailed life expectancy chart shows the dip to 67.2 years during the COVID-19 pandemic impact — a loss of several years of health progress compressed into a single epidemiological shock. By 2023, life expectancy had recovered to 72 years. The 1.7-year gap to the global average of 73.7 years remains. What the recovery does not show is the differential mortality burden: whose life expectancy fell furthest during COVID, whose recovered fastest, and whose has not recovered at all. A national average that rebounds is not the same as a population that rebounds uniformly. The aggregate is back. The equity question is still open.
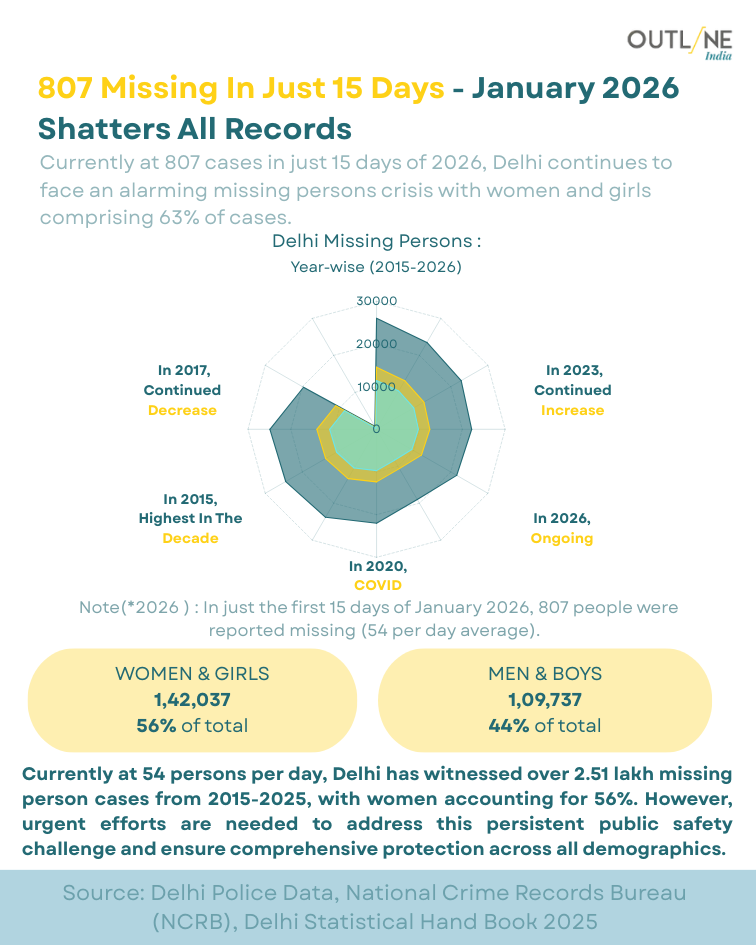
807 Missing in 15 Days, 54 Per Day, 56% Women and Girls — Delhi's Missing Persons Crisis Has a Gender Delhi recorded 807 missing person cases in just the first 15 days of January 2026 — 54 per day — with women and girls comprising 56% of all cases (1,42,037 women and girls versus 1,09,737 men and boys) across 2015–2025. The city has witnessed over 2.51 lakh missing person cases in a decade, with 2015 marking the highest point and 2020 showing a temporary COVID-era dip. Women and girls are disproportionately represented in every year of the data. Missing persons data in India is widely understood to be an undercount — cases not filed, families not trusting the system, women leaving dangerous homes counted as missing rather than fleeing. The 54-per-day figure is not an outlier. It is Tuesday in Delhi.
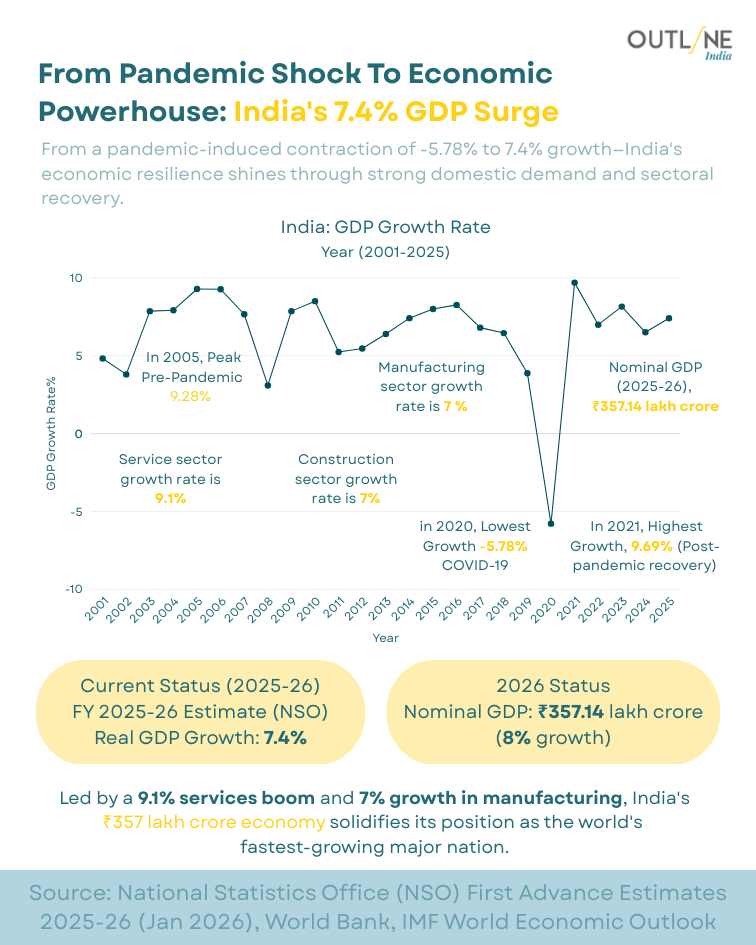
From -5.78% to 7.4% — India's Economic Recovery Is Real and Its Distribution Is the Question Nobody Asked India's GDP growth fell to its lowest point in 2020 at -5.78% due to COVID-19, recovered to its highest post-pandemic growth in 2021, and has stabilised at a real GDP growth rate of 7.4% for FY2025–26 (NSO First Advance Estimate). Nominal GDP stands at Rs.3,57,14 lakh crore, with a 2026 target of Rs.357.14 lakh crore at 8% nominal growth. A 9.1% services boom and 7% manufacturing growth headline the recovery. India is among the world's fastest-growing major economies. GDP growth as a national headline and GDP growth as experienced by the bottom two quintiles of the income distribution are often different economic events sharing the same percentage point.
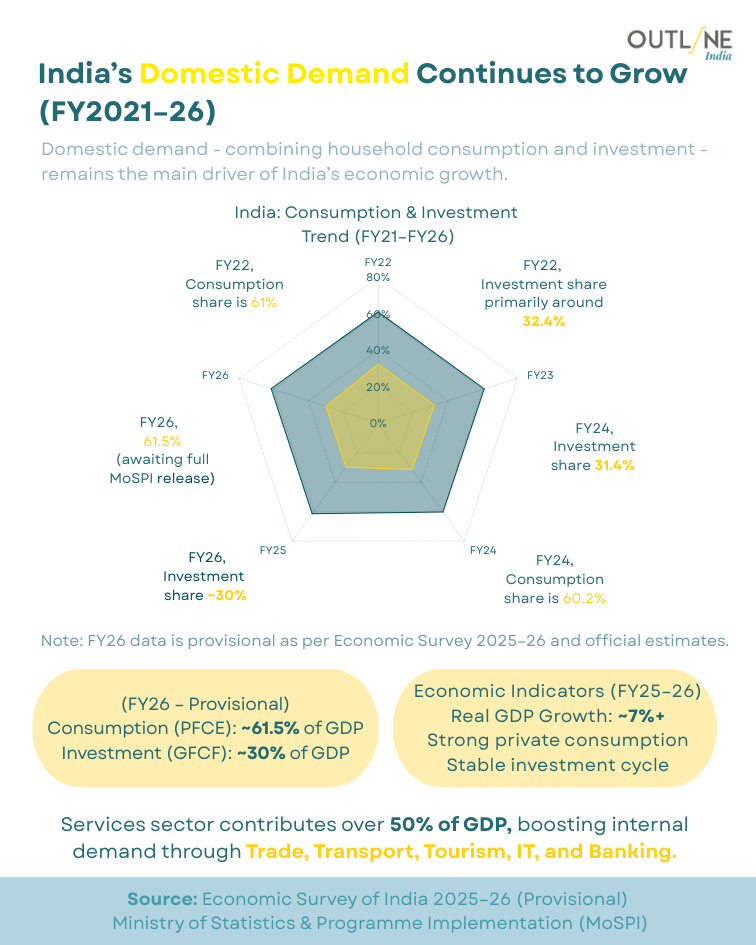
Consumption at 61.5% of GDP, Investment at 30% — and the Services Sector Is Carrying Both India's domestic demand — combining household consumption and investment — remains the main driver of economic growth from FY2021 to FY2026. Consumption share stands at approximately 61.5% of GDP (provisional FY26), investment (GFCF) at 30%. Real GDP growth for FY2025–26 is projected at 7%+, with strong private consumption and a stable investment cycle. The services sector contributes over 50% of GDP, boosting internal demand through trade, transport, tourism, IT, and banking. An economy where consumption is driven primarily by a services-sector middle class, while agricultural and informal workers remain outside the consumption-driven growth story, is one whose domestic demand figures tell the story of some of its domestic population.
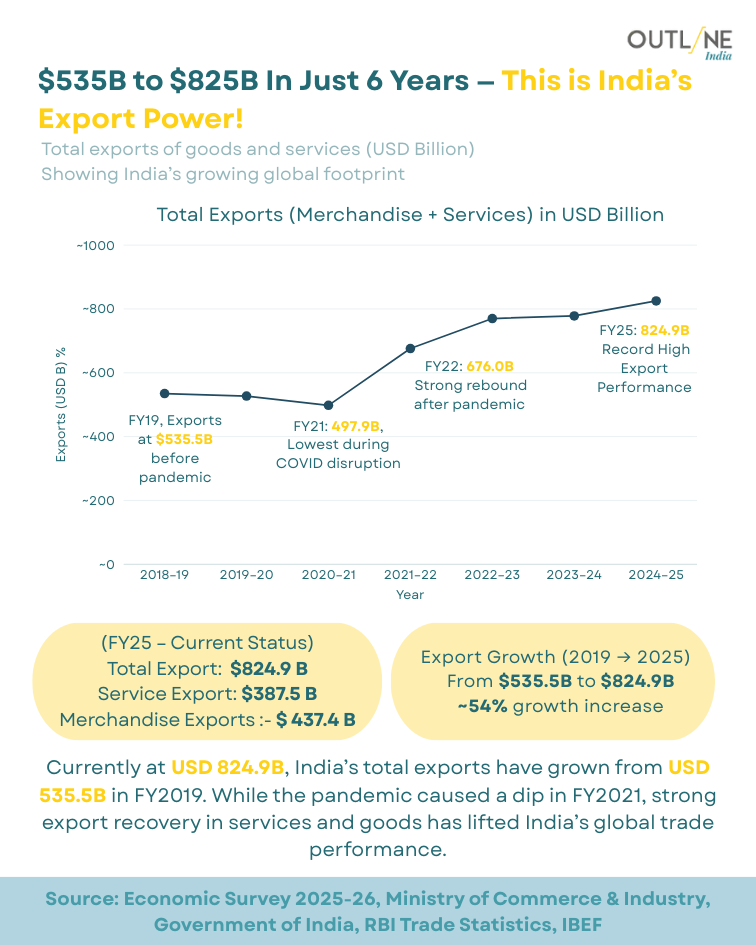
$535B to $825B in Six Years — India's Export Story Has a Services Footnote the Headline Buries India's total exports of goods and services grew from $535.8 billion in FY2019 to $824.9 billion in FY2025 — a 54% increase. Service exports stand at $387.5 billion, merchandise exports at $437.4 billion. The pandemic caused a dip in FY2020–21, followed by a strong rebound. FY25 marks record high export performance. Services exports — dominated by IT, business process management, and financial services — are the faster-growing and higher-margin component. Merchandise exports, which employ significantly more workers at lower wages, grow more slowly. An export figure that bundles a $387 billion services sector with a $437 billion merchandise sector is combining two very different employment and value-distribution profiles into a single, cheerful number.
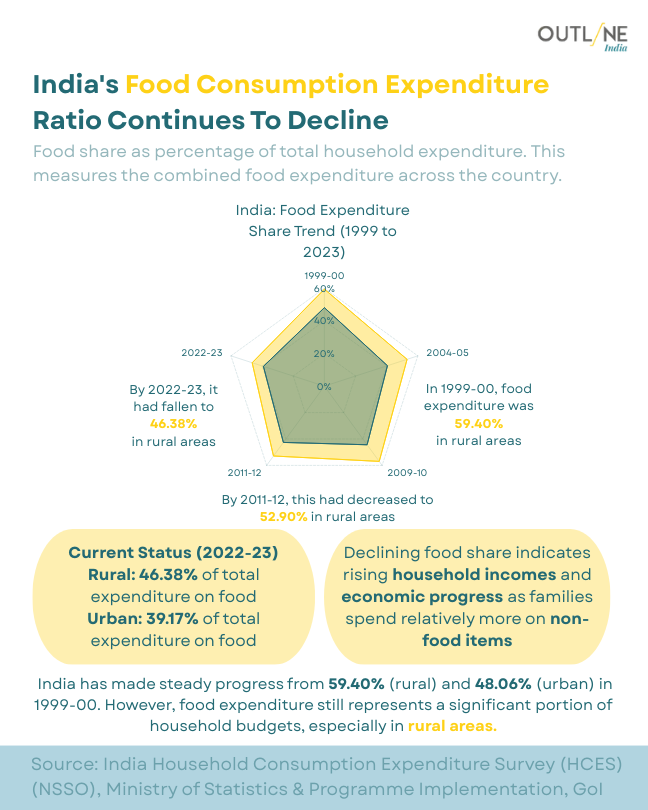
46.38% of Household Spending Goes to Food — Falling Share, Rising Absolute Cost, and Rural Families Feel Both India's food expenditure share of total household expenditure has declined from 59.40% in rural areas in 1999–2000 to 46.38% rural and 39.17% urban by 2022–23. A declining food share is conventionally interpreted as a sign of rising household incomes — families spending relatively more on non-food items. Food expenditure still represents a significant portion of household budgets, especially in rural areas. What the declining share does not capture is the rising absolute cost of food, the substitution of cheaper and less nutritious foods under price pressure, and the households whose food share is declining not because they are richer, but because they are eating less. A falling percentage can mean prosperity or austerity — and the average does not distinguish between them.
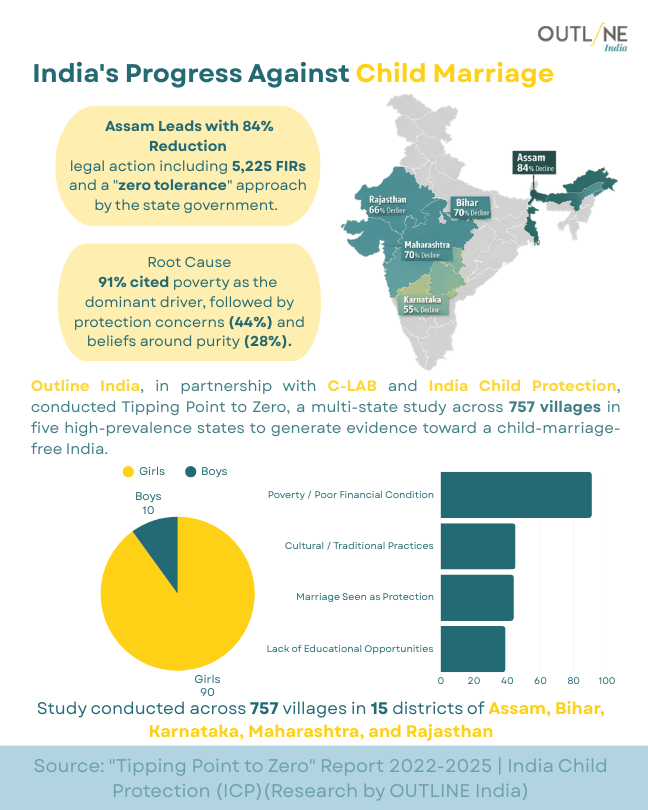
91% Cited Poverty as the Driver — Every Zero-Tolerance Policy That Ignores This Is Tolerance by Another Name The Tipping Point to Zero multi-state study across 757 villages in 15 districts of Assam, Bihar, Karnataka, Maharashtra, and Rajasthan found that 91% of respondents cited poverty or poor financial condition as the dominant driver of child marriage, followed by protection concerns (44%) and beliefs around purity (28%). Assam leads with 84% reduction through legal action including 5,225 FIRs and a zero-tolerance government approach. A zero-tolerance policy that penalises the marriage without addressing the poverty that makes it an economic calculation for families is a law enforcement intervention wearing a child protection label. The data names the cause. The policy response has not always followed it there.
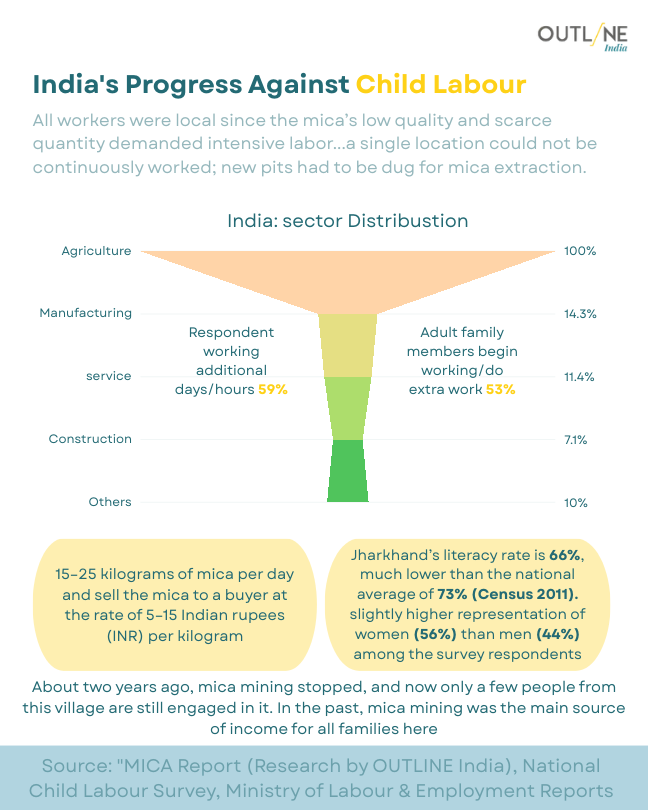
Almost Half Had No Formal Schooling — Mica Gave Children Work Because Adults Couldn't Afford to Stop Them A survey of child labour in mica mining found that almost half (47%) of respondents had no formal schooling, and only 2% had completed secondary education. Children in the 10–14 year primary working age group constitute 60% of child labourers in mica, with 25% in the 15–17 age group not included in the legal definition of child labour. Children enter mica mining primarily because of poverty and to help parents meet household or medical expenses. For 73% of the sample, mica is not the largest source of income — the state experiences significant out-migration due to limited income-generation opportunities. A substantial 50–60% of villagers resort to migration for lack of alternatives. Child labour here is not a cultural preference. It is a poverty trap with a mica-dusted floor.
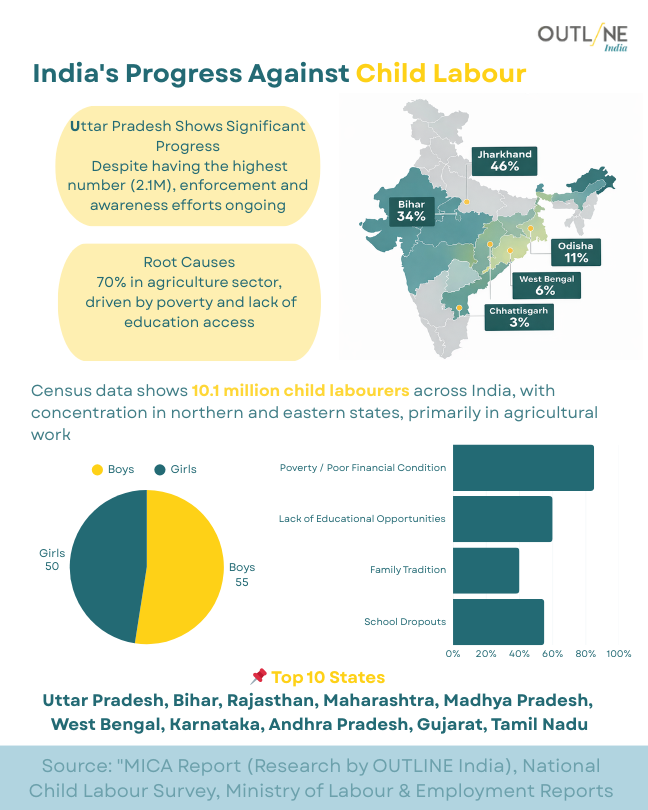
10.1 Million Child Labourers, 70% in Agriculture, and the Top 10 States Are a Map of India's Development Gaps Census data shows 10.1 million child labourers across India, concentrated in northern and eastern states primarily in agricultural work. Uttar Pradesh has the highest number at 12.1 million, with enforcement and awareness efforts ongoing. Jharkhand shows 46% prevalence. Root causes are 70% agriculture sector concentration, driven by poverty and lack of education access. The top 10 states — Uttar Pradesh, Bihar, Rajasthan, Maharashtra, Madhya Pradesh, West Bengal, Karnataka, Andhra Pradesh, Gujarat, Tamil Nadu — are not randomly distributed; they trace the contours of agrarian poverty, school non-completion, and social protection gaps. Child labour at this scale is not an enforcement failure alone. It is a welfare architecture failure that enforcement cannot substitute for.
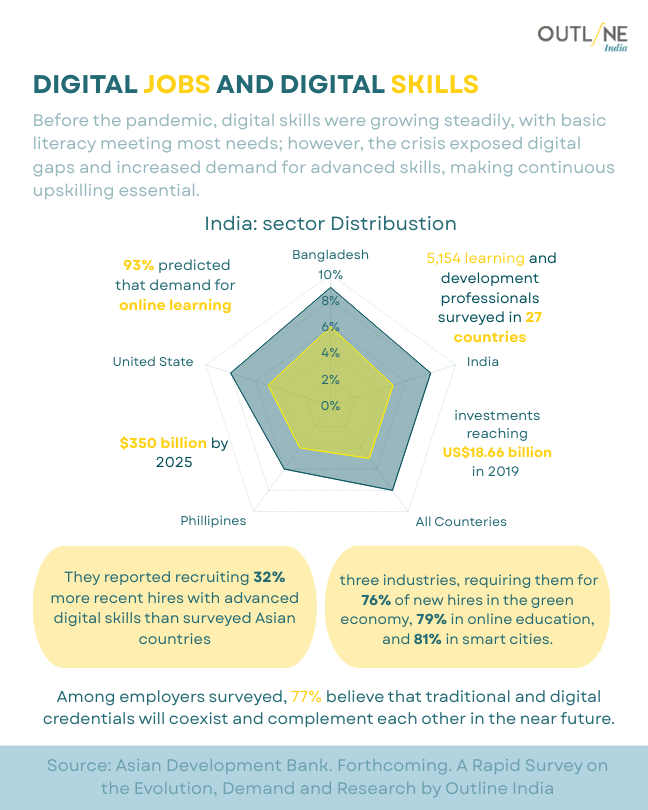
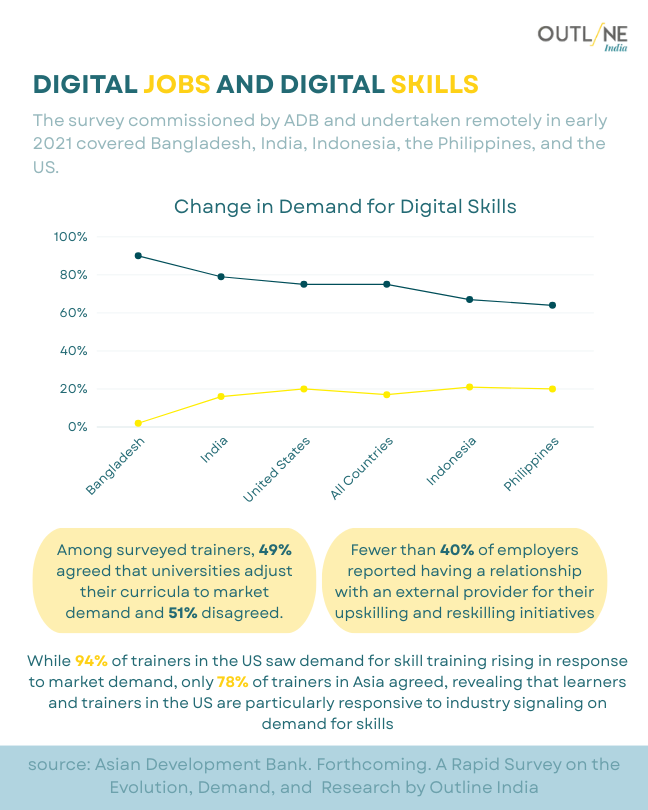
94% of US Trainers See Rising Skill Demand — Only 78% of Asian Trainers Do, and the Gap Is a Future Unemployment Figure The ADB-commissioned rapid survey of digital skills and jobs across Bangladesh, India, Indonesia, the Philippines, and the US found that 93% predicted demand for online learning would grow. Investments reached USD 18.66 million in 2019. Among surveyed trainers, 49% agreed that universities adjust curricula to market demand — 51% disagreed. Fewer than 40% of employers reported a relationship with an external provider for upskilling or reskilling initiatives. The skills economy requires employers to invest in training and education systems to respond to market signals. Neither is currently doing so at sufficient scale. The gap between the skills workers have and the skills jobs require does not announce itself — it shows up first as unemployment, then as a statistic.
49% of Trainers Agree Universities Respond to the Market — the Other 51% Are Describing the Graduates You Already Know The detailed digital skills chart shows demand for digital skills at 80–100% across surveyed countries, with trainer responsiveness to market demand varying significantly. While 94% of trainers in the US saw demand rising in response to skill training, only 78% of trainers in Asia agreed — revealing that learners and trainers in the US are particularly responsive to industry signals. Among employers, 77% believe traditional and digital credentials will coexist and complement each other in the near future. A training system where half the trainers do not believe universities adjust to market demand is producing graduates for a curriculum, not an economy. The 77% employer optimism about credential coexistence is more reassuring if you already have credentials. It is less useful if you do not.
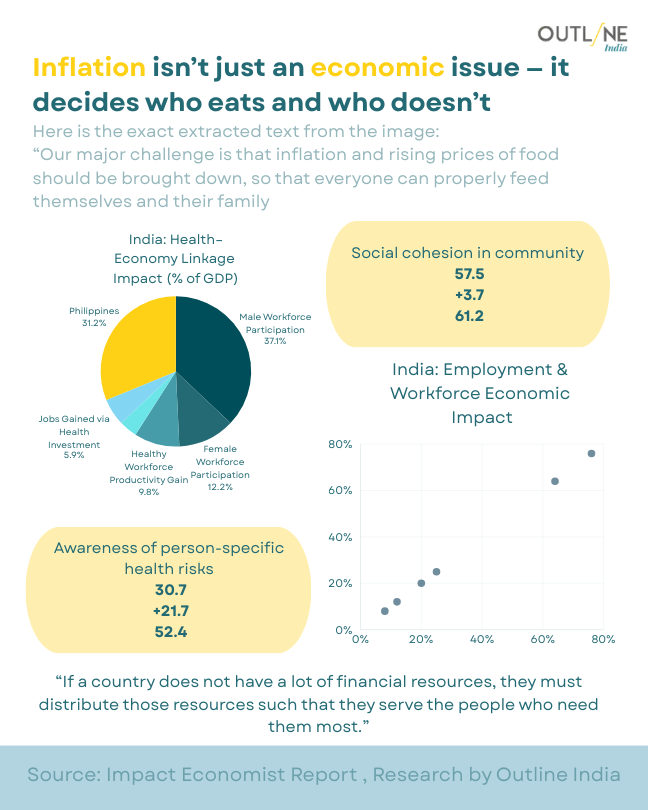
Social Cohesion Rose 3.7 Points — Health Risk Awareness Rose 24.7 Points — Neither Rose as Fast as Food Prices The detailed Employment and Workforce Economic Impact chart shows the scatter of India's health-economy outcomes across the measured indicators. Social cohesion improvement of +3.7 and health risk awareness improvement of +24.7 suggest that communities are becoming more aware of health risks faster than they are becoming more socially cohesive. The scatter distribution is wide — implying high variance in outcomes across the population. Knowing you are at health risk and being able to act on that knowledge are separated by income, infrastructure, and the cost of the nearest consultation. Awareness without access is a well-informed form of helplessness.
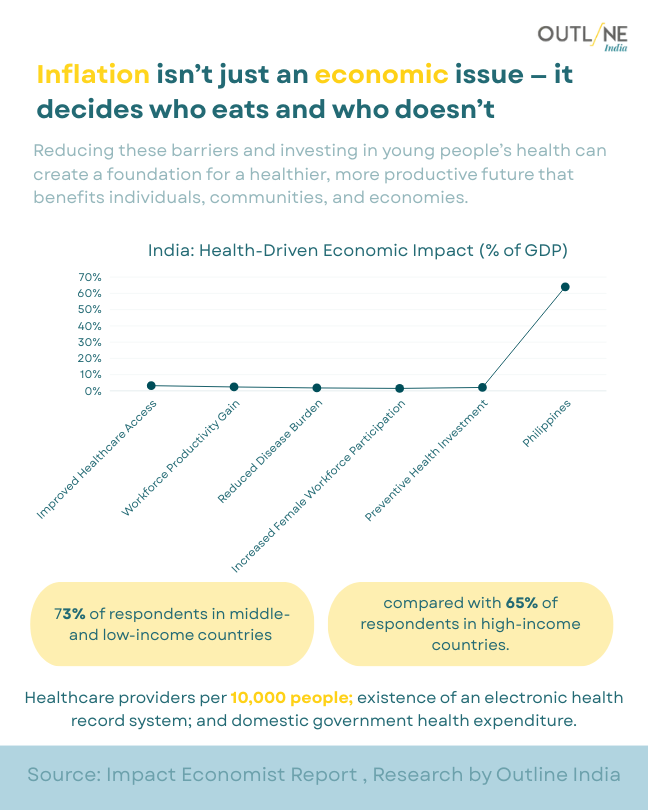
Rs. and Calories Are the Same Equation — the Health-Economy Linkage Chart Says What Food Insecurity Studies Have Said for Decades The Health-Economy Linkage chart for India shows male workforce participation at 79.63%, female workforce participation at 13.72%, jobs raised via wealth at 3.96%, and wealthy workforce participation at various levels. Social cohesion in community averages 57.5 with a +3.7 improvement to 61.2. Awareness of person-specific health risks averages 30.7, with a +24.7 improvement to 52.4. The India Employment and Workforce Economic Impact scatter shows a wide distribution. The quote embedded in the data — 'If a country does not have a lot of financial resources, they must distribute those resources such that they serve the people who need them most' — is a distributive justice argument inside an economics report. It has been true for as long as the data has been collected.
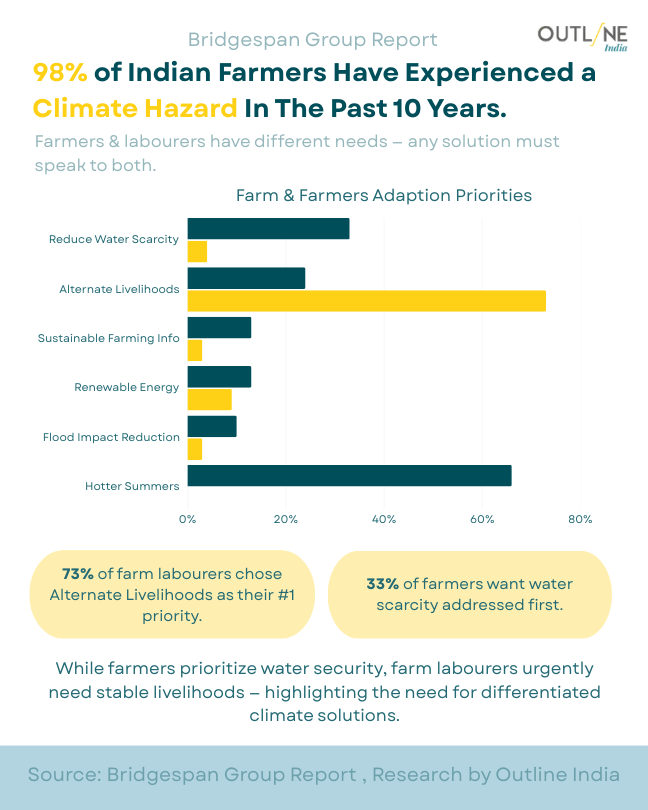
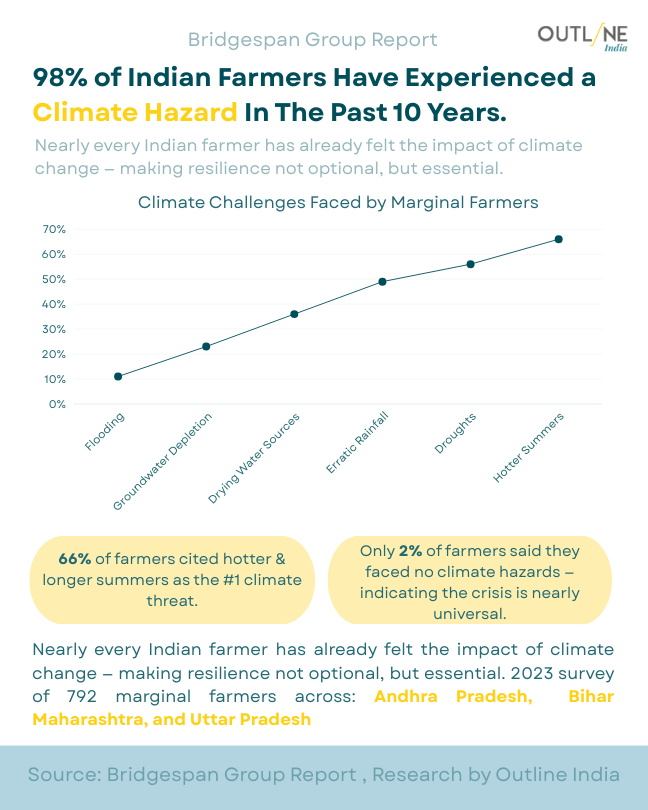
98% of Farmers Felt a Climate Hazard — the 2% Who Didn't Are an Outlier, Not a Reassurance A 2023 survey of 792 marginal farmers across Andhra Pradesh, Bihar, Maharashtra, and Uttar Pradesh found that 98% had experienced at least one climate hazard in the past ten years — making resilience not optional but essential. Flooding, groundwater depletion, drying water sources, erratic rainfall, droughts, and hotter summers are all tracked. Some 66% of farmers cited hotter and longer summers as the #1 climate threat. Only 2% said they faced no climate hazards. A survey finding that virtually every farmer in the sample has been affected by climate change is not a baseline — it is an emergency result being published in a report format. The crisis is nearly universal. The response infrastructure is not.
Farmers Want Water Security. Labourers Want Alternative Livelihoods. Policy Is Offering Both Groups the Same Solution Farm and farmer adaptation priority data from the Bridgespan Group Report shows that 73% of farm labourers chose alternative livelihoods as their #1 priority, while 33% of farmers chose water scarcity as their first concern. The priorities diverge sharply: farmers prioritise water security, sustainable farming information, renewable energy, and flood impact reduction; labourers prioritise income alternatives and hotter summer mitigation. While farmers and farm labourers share the same field, they do not share the same risk calculus or the same survival strategy. A climate adaptation policy designed for farmers may be addressing the wrong person's most urgent need when it reaches the labourer who works that farm.
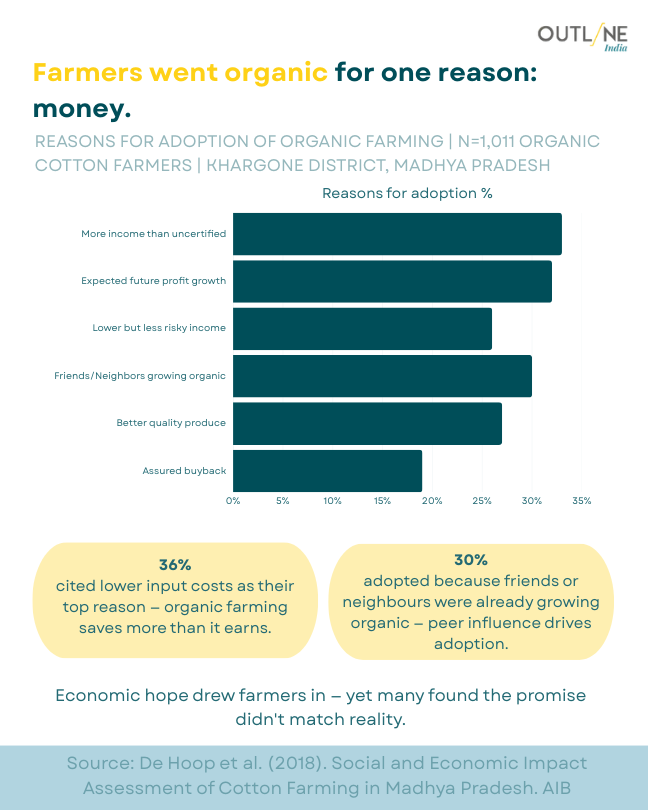
Farmers Went Organic for Money — and 55% of Them Found That the Money Didn't Come Among 1,011 organic cotton farmers in Khargone District, Madhya Pradesh, the top reasons for adoption of organic farming were more income than uncertified farming, expected future profit growth, lower but less risky income, peer influence (friends and neighbours growing organic), better quality produce, and assured buyback. Some 36% cited lower input costs as their primary reason — organic farming saves more than it earns, in theory. Some 30% adopted because neighbours were already doing it — peer influence drove adoption faster than profitability data did. Of exclusive organic farmers, only 45% make any positive profit before accounting for family labour. Economic hope drew farmers in; many found the promise didn't match the reality. The adoption curve and the income curve are not the same curve.
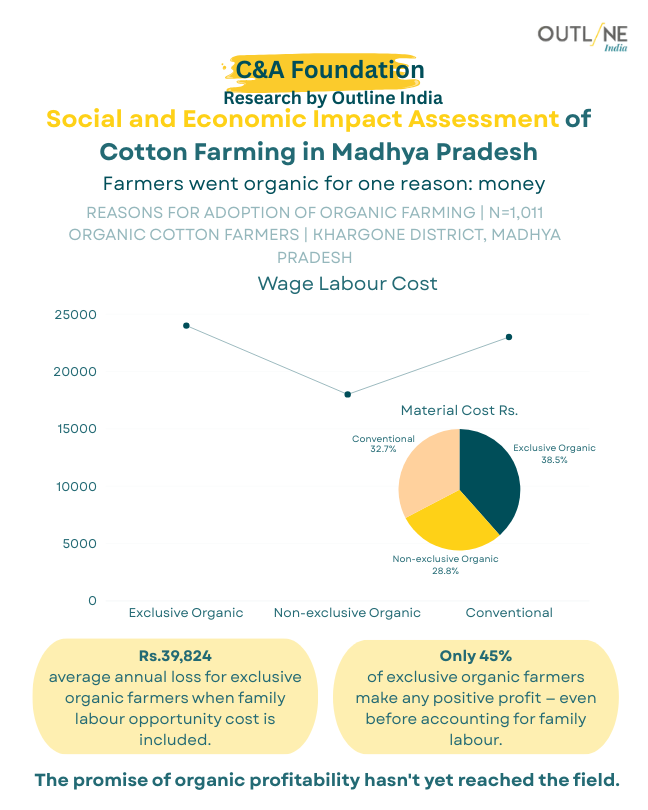
Rs.39,824 Average Annual Loss — the Organic Premium Goes to the Brand, the Loss Stays With the Farmer The C&A Foundation's Social and Economic Impact Assessment of cotton farming in Madhya Pradesh found that wage labour cost data shows exclusive organic farmers averaging an annual loss of Rs.39,824 when family labour opportunity cost is included. Material costs for exclusive organic farming stand at 30.3%, compared to 27.7% for conventional farming. Only 45% of exclusive organic farmers make any positive profit, even before accounting for family labour. The certification that makes organic cotton worth more in a European store does not make the farmer's balance sheet better. It makes the supply chain's sustainability claim better. The farmer is the instrument of that claim, not its beneficiary.
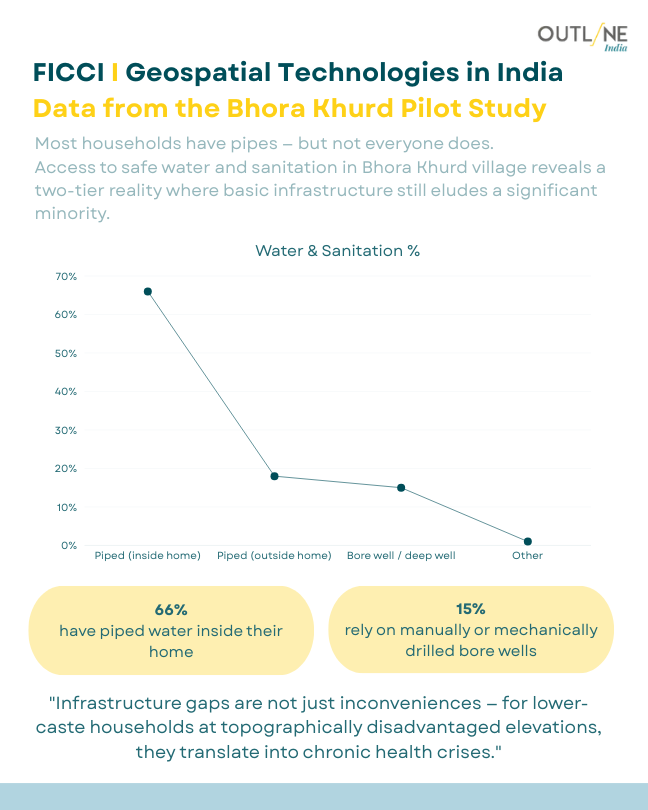
66% Have Piped Water Inside the Home — the Other 34% Are Still Walking to It Data from the FICCI Geospatial Technologies Bhora Khurd Pilot Study reveals a two-tier reality in basic infrastructure access. Some 66% of households have piped water inside their home; 15% rely on manually or mechanically drilled bore wells; the remainder use piped external sources, dug wells, or other means. Infrastructure gaps are not inconveniences for lower-caste households at topographically disadvantaged elevations — they translate into chronic health crises, as the study notes. Geospatial mapping has made the distribution of access visible in ways that administrative reporting often cannot. The map shows who has water. The policy question is why, in a village with 66% piped access, the remaining 34% have not been connected — and whether it is geography, caste, or cost that keeps them waiting.
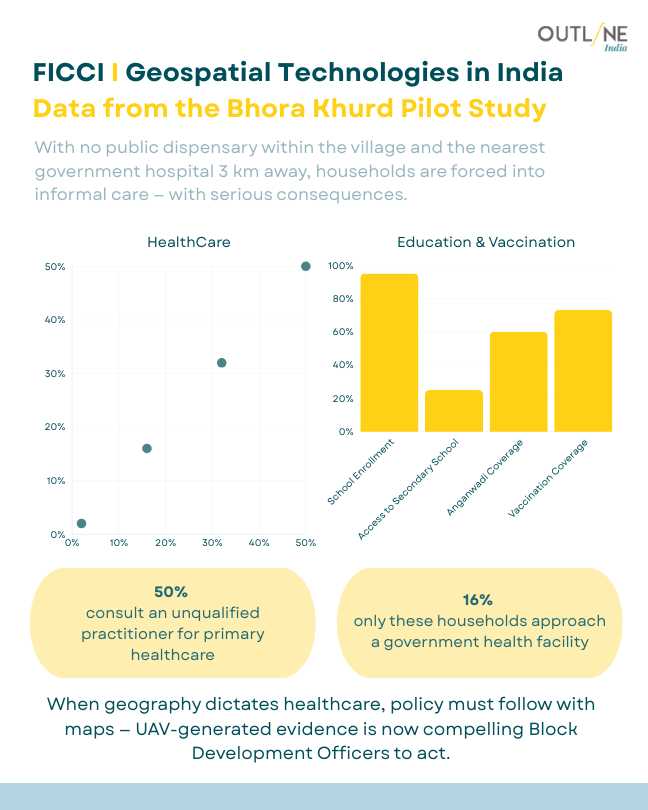
50% See Unqualified Practitioners — No Public Dispensary, Government Hospital 3km Away, Consequences Predictable With no public dispensary within Bhora Khurd village and the nearest government hospital 3km away, 50% of households consult an unqualified practitioner for primary healthcare. Only 16% approach a government health facility. Education and vaccination data shows varied access to formal schooling, anganwadi attendance, and vaccination coverage. When geography dictates healthcare, policy must follow with maps — UAV-generated evidence is now compelling Block Development Officers to act. The insight is correct. The lag between compelling evidence and changed behaviour at the government level is where the preventable illness and death accumulate. Drones can map the gap. They cannot close it.
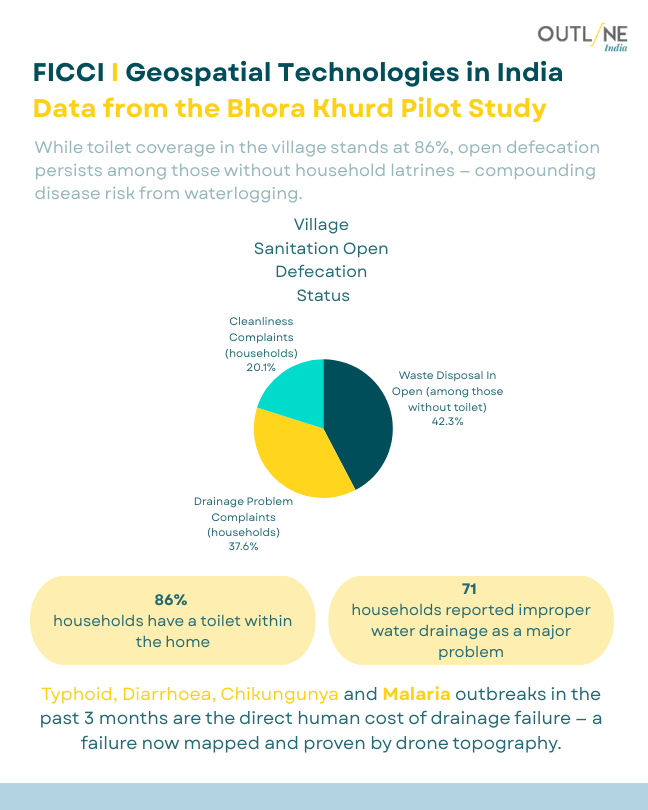
86% Have a Toilet — 12.35% Still Dispose of Waste in the Open, and Typhoid, Diarrhoea, and Malaria Follow the Map Village sanitation data from Bhora Khurd shows 86% of households have a toilet within the home, yet 12.35% of waste disposal occurs in the open among those without toilets. Drainage problem complaints affect 57.6% of households, and 71 households reported improper water drainage as a major problem. Cleanliness complaints stand at 20.96%. Typhoid, diarrhoea, chikungunya, and malaria outbreaks in the past three months are the direct human cost of drainage failure — a failure now mapped and proven by drone topography. The ODF declaration and the disease burden are not contradictory data points. They are the same data point, measured by different agencies at different scales.
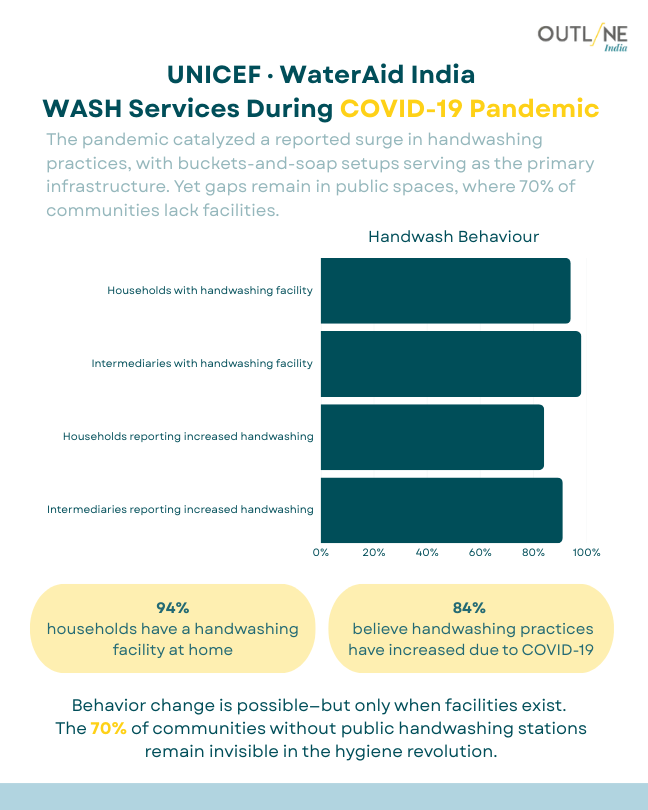
94% Have a Handwashing Facility — the 70% of Communities Without Public Stations Are Still Invisible to the Hygiene Revolution The UNICEF-WaterAid India study on WASH services during COVID found that 94% of households have a handwashing facility at home, and 84% believe handwashing practices increased due to the pandemic. Behaviour change is possible when facilities exist — the pandemic demonstrated that at scale. Yet 70% of communities lack public handwashing facilities, meaning the hygiene gains of COVID are private gains, concentrated in households that already had water access. The infographic's own conclusion names it: the 70% without public stations remain invisible in the hygiene revolution. A public health behaviour that only happens at home is not public health. It is private hygiene with a public health label.
94% Have a Handwashing Facility — the 70% of Communities Without Public Stations Are Still Invisible to the Hygiene Revolution The UNICEF-WaterAid India study on WASH services during COVID found that 94% of households have a handwashing facility at home, and 84% believe handwashing practices increased due to the pandemic. Behaviour change is possible when facilities exist — the pandemic demonstrated that at scale. Yet 70% of communities lack public handwashing facilities, meaning the hygiene gains of COVID are private gains, concentrated in households that already had water access. The infographic's own conclusion names it: the 70% without public stations remain invisible in the hygiene revolution. A public health behaviour that only happens at home is not public health. It is private hygiene with a public health label.
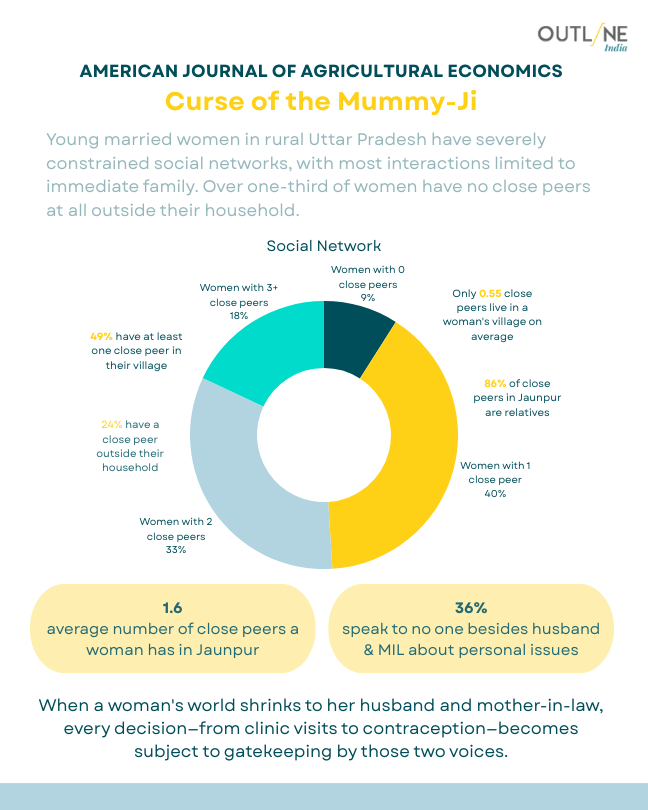
1.6 Close Peers on Average — When a Woman's World Is That Small, Every Decision Gets Filtered Through It Research published in the American Journal of Agricultural Economics on young married women in rural Uttar Pradesh found that the average woman in Jaunpur has 1.6 close peers. Some 40% have at least one close peer in their village; 20% have a close peer outside their household. Over one-third of women have no close peers at all outside their household. Some 75% of close peers in Jaunpur are relatives; 36% speak to no one besides husband and mother-in-law about personal issues. When a woman's social world contracts to her husband and mother-in-law, every decision — including reproductive health, contraception, clinic visits — becomes subject to gatekeeping by those two voices. The social network data is not background context. It is the mechanism through which all other interventions either succeed or fail.
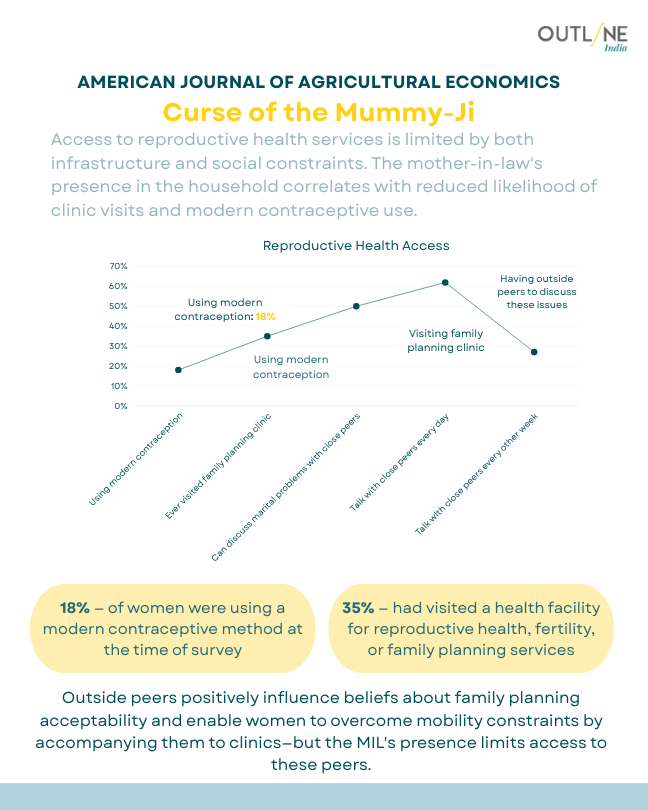
18% Using Modern Contraception, 35% Visited a Health Facility — the Mother-in-Law Attended Both Decisions The reproductive health access data shows that only 18% of women were using a modern contraceptive method at the time of the survey, and 35% had visited a health facility for reproductive health, fertility, or family planning services. Outside peers positively influence beliefs about family planning acceptability and help women overcome mobility constraints by accompanying them to clinics. The mother-in-law's presence in the household correlates with reduced likelihood of clinic visits and modern contraceptive use. A health system that places reproductive choice inside a household where the mother-in-law controls mobility and social legitimacy has not delivered that choice to the woman — it has delivered it to the household structure, and hoped for the best.
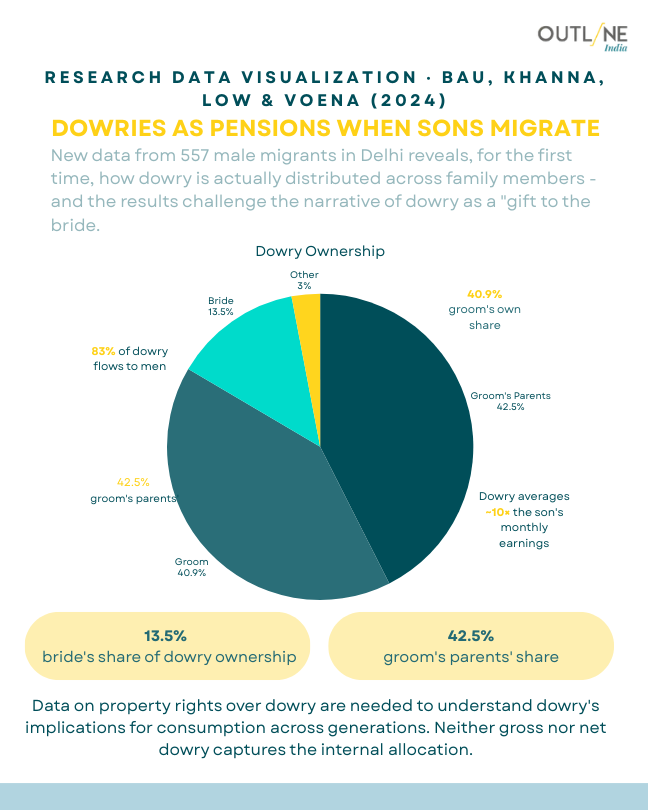
42.5% of Dowry Goes to the Groom's Parents — the Gift to the Bride Was Always a Pension for Someone Else Research by Bau, Khanna, Low and Voena (2024) using data from 557 male migrants in Delhi reveals that 40% of dowry flows to men themselves, 42.35% goes to the groom's parents, and only 13.5% remains as the bride's share of dowry ownership. Dowry averages 1.5 times the son's monthly earnings. The study challenges the narrative of dowry as a gift to the bride — when 42.5% of it goes to the groom's parents and 40% to the groom, the bride's 13.5% share makes her less a recipient and more a transaction. Data on property rights over dowry are needed to understand its implications for consumption across generations. Neither gross nor net dowry captures the internal allocation — which is precisely where the inequality lives.
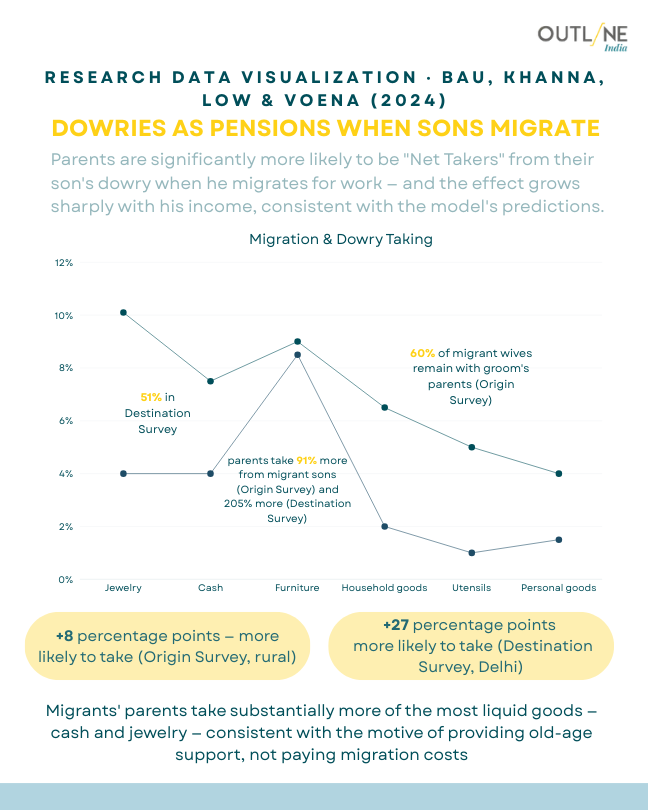
Parents Take More From Migrant Sons — the Dowry Was Never Just About the Wedding Research by Bau, Khanna, Low and Voena (2024) using migration and dowry survey data finds that parents take 17% more from migrant sons in origin surveys and 20% more in destination surveys — a pattern consistent with the model of dowry as old-age insurance, not matrimonial gift. Parents are +8 percentage points more likely to take dowry in origin (rural) surveys, and +27 percentage points more likely in destination (Delhi) surveys. Some 60% of migrant wives remain with the groom's parents in the origin survey. Migrants' parents take substantially more of the most liquid goods — cash and jewellery — consistent with the motive of providing old-age support, not paying migration costs. The narrative of dowry as a cultural practice directed at the bride survives primarily because the financial flows within the groom's household are rarely surveyed. This research maps them. The map is not flattering.
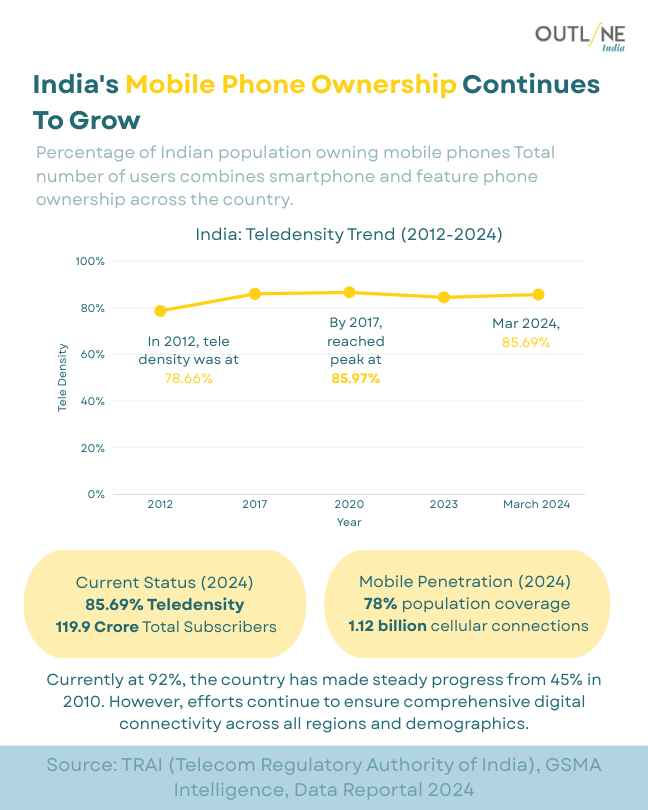
85.69% Teledensity, 1.12 Billion Connections — and the Phone in Every Hand Is Not Doing the Same Work for Every Hand India's teledensity has grown from 78.66% in 2012 to a peak of 85.97% in 2017, dipping slightly through 2020 and stabilising at 85.69% by March 2024. The country now has 119.9 crore total subscribers and 1.12 billion cellular connections, with 78% population coverage for mobile penetration — and the broader claim that connectivity has reached 92% of the country from 45% in 2010. These are infrastructure numbers of genuine scale. What they combine, without distinguishing, is smartphone ownership and feature phone ownership — two very different instruments of digital participation. A feature phone connects a person to voice calls and SMS; a smartphone connects a person to UPI payments, government portals, job listings, telemedicine, and the digital economy that India's policy ambitions are being built around. Teledensity counts both as equivalent subscribers. They are not equivalent citizens of the digital state. The 85.69% figure tells you a SIM card exists. It does not tell you whether the person holding it can file an income tax return, access a health record, or apply for a government scheme — all of which now assume connectivity that a feature phone cannot deliver. Efforts continue to ensure comprehensive digital connectivity across all regions and demographics, as the infographic notes. The gap between a cellular connection and a usable digital life is where that effort actually needs to be directed.
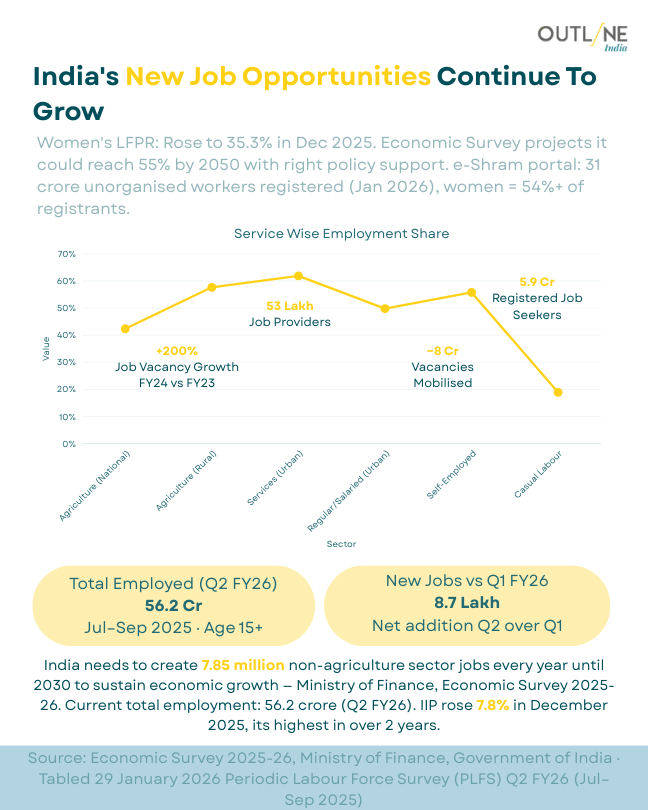
56.2 Crore Employed, IIP Rose 7.8% — the Numbers Are Growing, the Jobs May Not Be Enough India's Employment data for Q2 FY26 shows total employed at 56.2 crore (July–September 2025, age 15+), with 8.7 lakh net new jobs added in Q2 FY26 over Q1. Women's LFPR rose to 35.3% in December 2025. The Economic Survey projects employment could reach 35.3% with right policy support, and 31 crore unorganised workers have been registered on the e-Shram portal, with women comprising 54%+ of registrants. India needs to create 7.85 million non-agriculture sector jobs every year until 2030 to sustain economic growth. Registered job seekers are recorded at 59 crore against a significantly smaller number of vacancies mobilised. The gap between job seekers and available vacancies — visible in the infographic's own data — is not a framing problem. It is a structural employment deficit that no registration portal can substitute for.
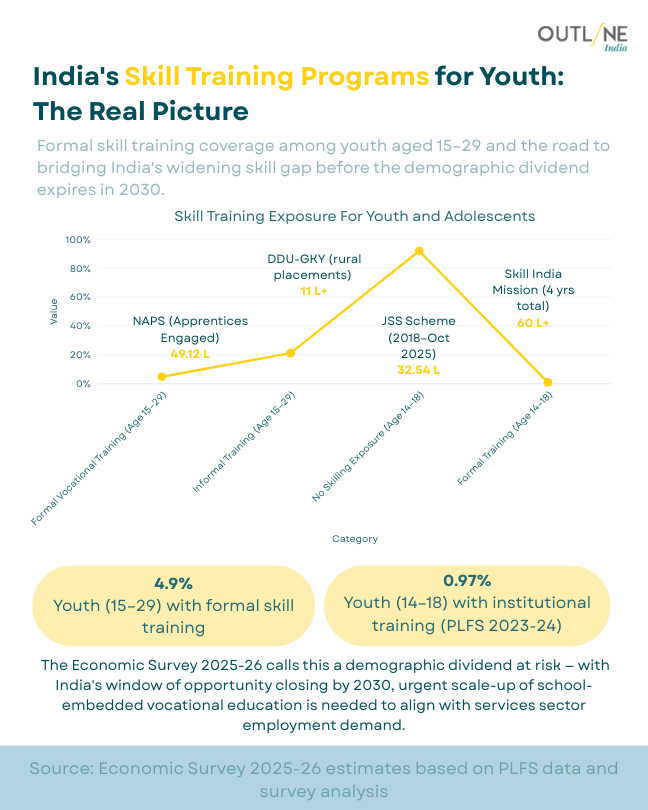
4.9% of Youth Formally Skilled — the Demographic Dividend Has a 2030 Expiry Date and We Are Burning the Clock Formal skill training exposure among India's youth aged 15–29 stands at just 4.9%, with only 0.97% of youth aged 14–18 receiving institutional vocational training (PLFS 2023–24). Schemes including DDU-GKY, NAPS, Skill India Mission, and JSS cover various cohorts but have not yet achieved scale proportional to the challenge. The Economic Survey 2025–26 explicitly calls this a demographic dividend at risk — with India's window of opportunity closing by 2030. Urgent scale-up of school-embedded vocational education is needed to align with services-sector employment demand. A country with the world's largest youth population, a 4.9% formal skilling rate, and a closing window of demographic advantage is not managing a skills gap. It is managing a demographic emergency in slow motion.
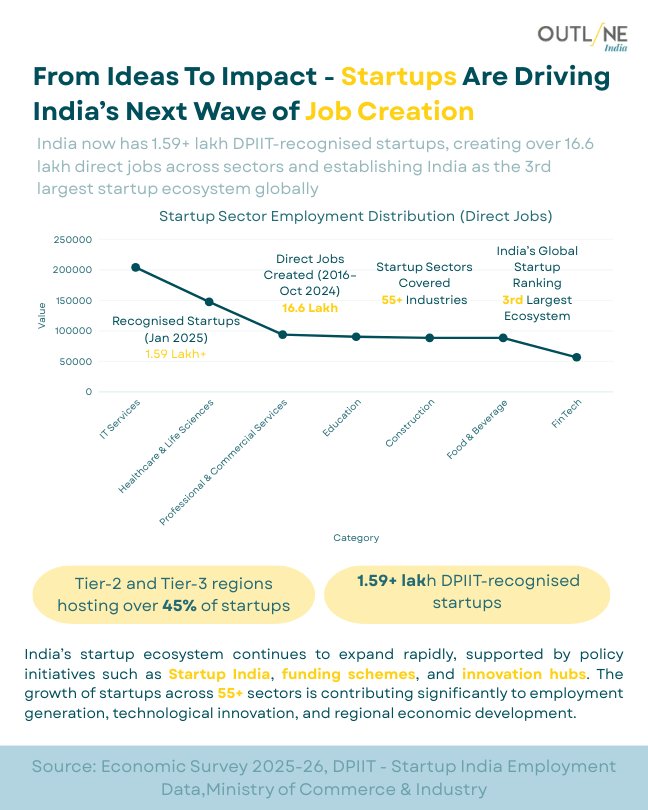
1.59 Lakh Startups, 3rd Largest Ecosystem — and Tier-2 Cities Are Doing 45% of the Work Nobody Talks About India now has 1.59 lakh DPIIT-recognised startups, creating over 16.6 lakh direct jobs across sectors and establishing India as the 3rd largest startup ecosystem globally. Direct jobs created from 2016 to October 2024 stand at 16.6 lakh. Tier-2 and Tier-3 regions are hosting over 45% of startups — a geographic distribution that the infographic rightly flags as notable. Startup India, funding schemes, and innovation hubs support continued expansion across 55+ sectors. What the direct job count does not capture is the precarity, informality, and equity concentration at the top of startup employment — where founders and senior employees hold disproportionate gains, and delivery workers, gig employees, and contract staff are counted in the same 16.6 lakh figure. 1.59 lakh startups is an ecosystem statistic. 16.6 lakh jobs is a labour market statistic. They require different questions.
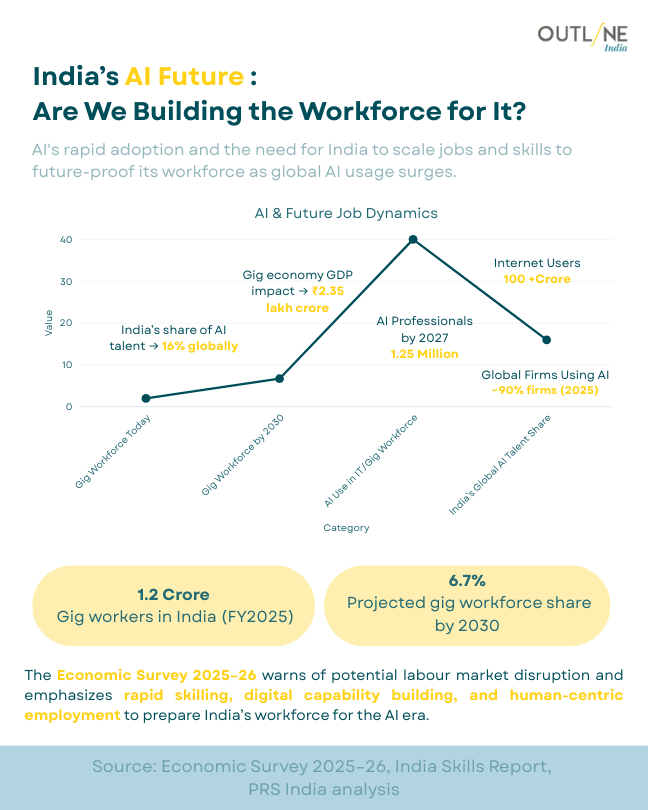
1.2 Crore Gig Workers, 6.7% of the Workforce by 2030 — and the AI That Is Replacing Them Is Not Being Taught to Them India's share of global AI talent stands at 16%, with 1.25 million AI professionals projected by 2027 and 150+ crore internet users. The gig economy's GDP impact is projected at 1.25 lakh crore, with 1.2 crore gig workers in FY2025 and a projected 6.7% gig workforce share by 2030. Global firms using AI include 90%+ from 100 USD. The Economic Survey 2025–26 warns of potential labour market disruption and emphasises rapid skilling, digital capability building, and human-centric employment to prepare India's workforce for the AI era. A country where 4.9% of youth receive formal skill training, where the gig economy is already the fastest-growing employment category, and where AI adoption is accelerating at the top of the skills distribution has a widening labour market gap at its base. The warning is in the Survey. The investment to prevent it is not yet in the budget.
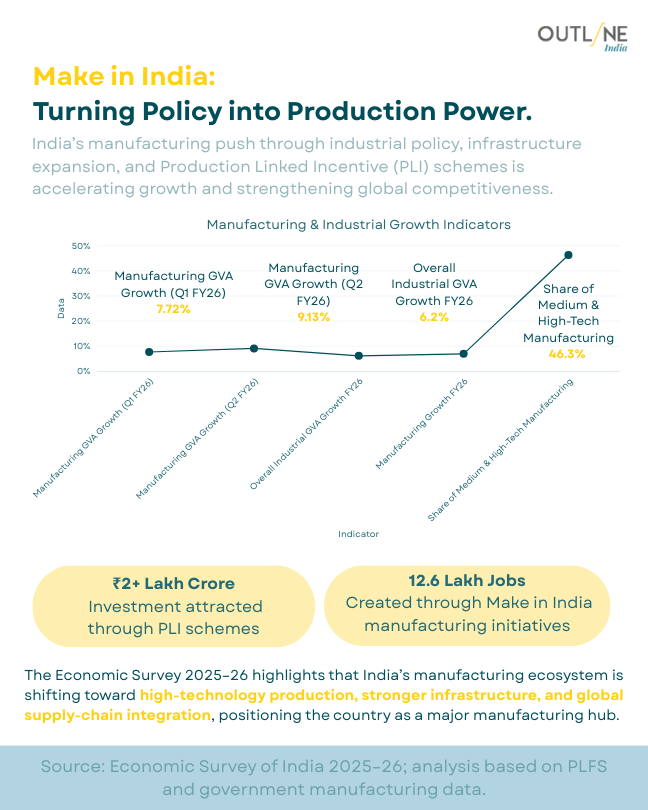
72+ Lakh Crore Attracted, 12.6 Lakh Jobs Created — the Investment and the Employment Are Not Growing at the Same Rate India's manufacturing push through industrial policy, infrastructure expansion, and PLI schemes has attracted 72+ lakh crore in investment and created 12.6 lakh jobs through Make in India manufacturing initiatives. Manufacturing GVA growth in Q1 FY26 stands at 3.7%, with overall industrial GVA growth at 6.2%. The share of medium and high-tech manufacturing is 46.3%. The Economic Survey 2025–26 highlights a shift toward high-technology production, stronger infrastructure, and global supply-chain integration. A 72+ lakh crore investment figure and a 12.6 lakh job creation figure in parallel raise a question the infographic does not: if capital intensity is rising — as high-tech manufacturing implies — the relationship between investment and employment generation is not proportional. More investment, fewer jobs per crore, and a larger population waiting for those jobs is not a manufacturing success story without a workforce absorption plan attached.
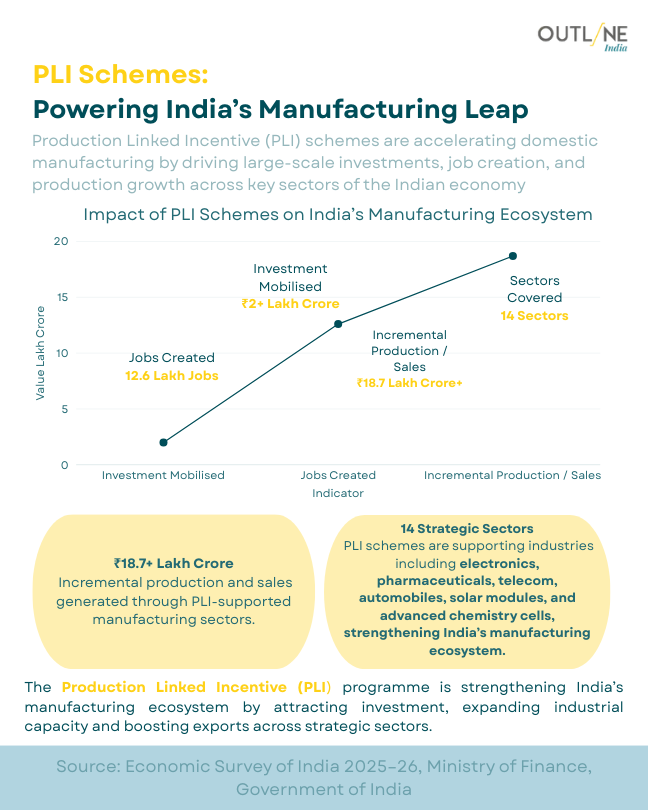
13.6 Lakh Crore Mobilised, 14 Sectors, 13.4 Lakh Jobs — the Multiplier Is Real and Still Not Large Enough India's Production Linked Incentive schemes have mobilised 7.2+ lakh crore in investment, created 13.4 lakh direct jobs, and generated 18.7+ lakh crore in incremental production and sales across 14 strategic sectors including electronics, pharmaceuticals, telecom, automobiles, solar modules, and advanced chemistry cells. The programme is strengthening India's manufacturing ecosystem by attracting investment, expanding industrial capacity, and boosting exports. PLI schemes represent a fiscal architecture designed to subsidise production until domestic competitiveness takes hold. Whether the sectors selected — capital-intensive, skill-intensive, globally competitive — are the sectors best suited to absorbing India's labour surplus is the question industrial policy has always had to answer. High-value manufacturing and high-employment manufacturing are often different categories. PLI is optimising for the former.
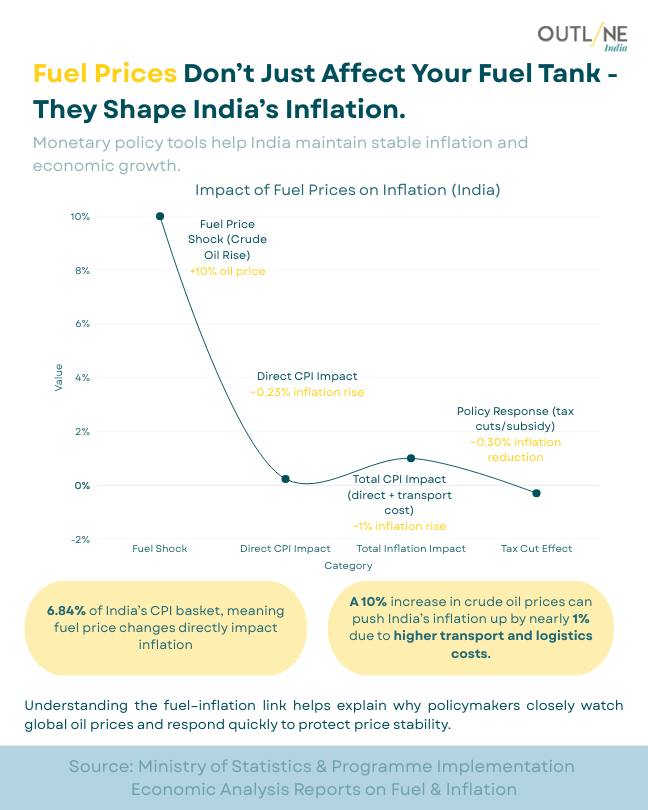
6.84% of the CPI Basket Is Fuel — a 10% Oil Shock Pushes Inflation by Nearly 1%, and the Poorest Household Pays the Full Percentage Fuel prices account for 6.84% of India's CPI basket, meaning fuel price changes directly and immediately impact inflation across the economy. A 10% increase in crude oil prices can push India's inflation up by nearly 1% due to higher transport and logistics costs — a transmission that travels through every supply chain, every vegetable vendor, and every household that cannot switch to a cheaper alternative. The fuel-inflation cascade works in three documented steps: a fuel price shock of +10% on crude oil leads to a direct CPI impact of 0.23% inflation rise, then a total CPI impact — accounting for direct plus transport costs — of 1% inflation rise, and finally a policy response through tax cuts and subsidies that reduces the inflation impact by 0.35%. Understanding the fuel-inflation link helps explain why policymakers closely watch global oil prices and respond quickly to protect price stability. What the infographic does not show is the asymmetry in this link: when crude prices fall, the policy response has historically been to absorb the reduction into excise tax rather than pass it to consumers — meaning the 6.84% basket weight functions as a floor for government revenue and a ceiling for consumer relief. The monetary policy tools that help India maintain stable inflation and economic growth are designed around national averages. For a family in rural Bihar spending 15% of its income on kerosene, cooking gas, and auto-rickshaw fares, the effective fuel weight in lived inflation is not 6.84%. It is the difference between eating two meals and three.
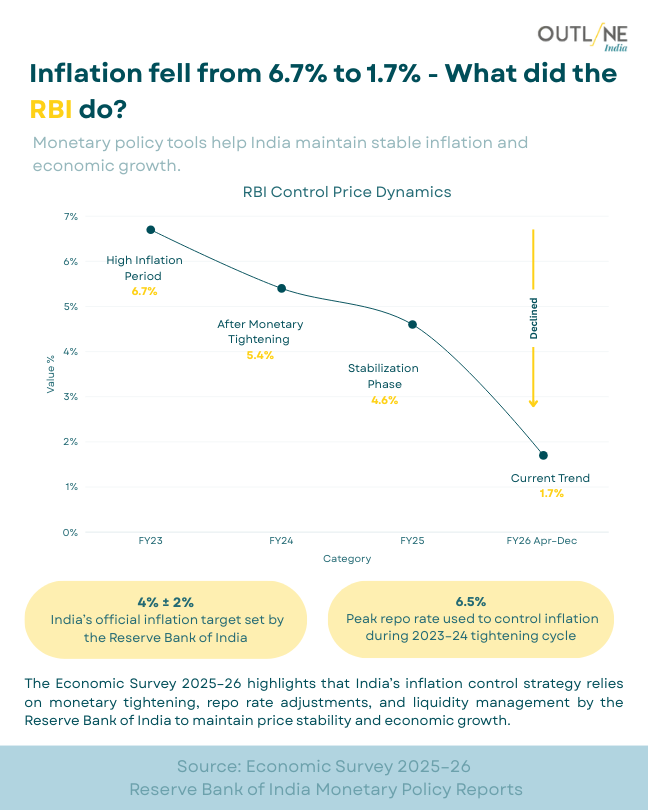
Inflation Fell from 6.7% to 1.7% — the Medicine Worked, and the Patient Who Couldn't Afford Food During Treatment Was Not in the Data India's inflation has fallen from a high inflation period of 6.7% in FY23, through monetary tightening at 6.5%, a stabilisation phase at 4.6%, to a current trend of 1.7% — within the 4% ± 2% official target set by the Reserve Bank of India. The peak repo rate used to control inflation during 2023–24 was 6.5%. The Economic Survey 2025–26 highlights that India's inflation control strategy relies on monetary tightening, repo rate adjustments, and liquidity management by the Reserve Bank. Inflation at 1.7% is a macroeconomic success by conventional measure. It is achieved through interest rate increases that raise the cost of borrowing — compressing consumption and investment, with the sharpest effects on households that depend on credit for daily survival. The CPI basket that measures inflation includes food. The households for whom food inflation meant skipped meals are not visible in the stabilisation chart.
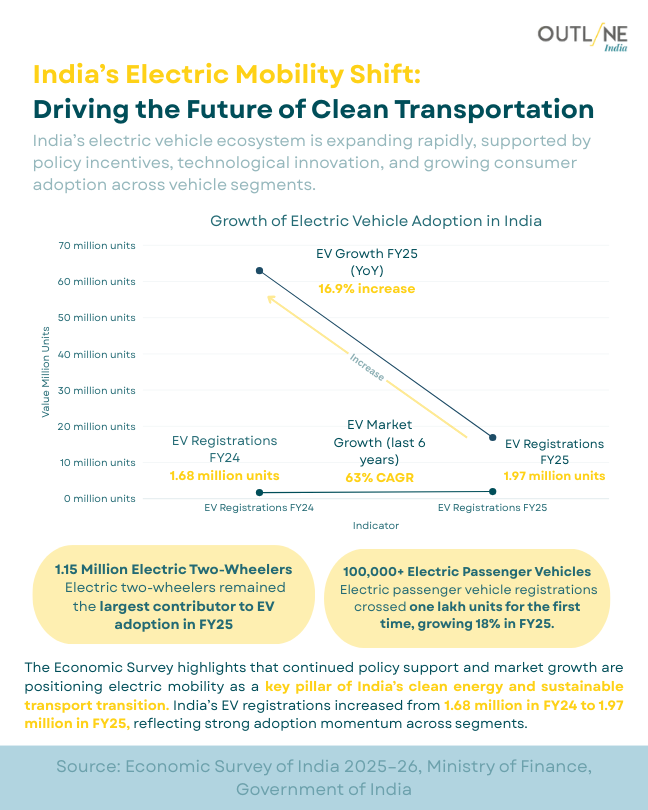
1.97 Million EV Registrations in FY25, 16.9% YoY Growth — and One Lakh Electric Passenger Vehicles for a Country of 1.4 Billion India's EV ecosystem has grown from 1.48 million EV registrations in FY24 to 1.97 million in FY25 — a 16.9% year-on-year increase. Electric passenger vehicle registrations crossed one lakh units for the first time in FY25, growing 18%. The EV market has shown 43% CAGR over the last six years. Electric two-wheelers remain the largest contributor to EV adoption. Continued policy support and market growth are positioning electric mobility as a key pillar of India's clean energy and sustainable transport ambitions. Electric passenger vehicles at one lakh units — in a country where approximately 25 lakh petrol and diesel passenger vehicles are sold annually — is a trajectory, not yet a transition. Two-wheelers dominate EV adoption because they are affordable, not because the policy is equitable. The EV story is still primarily an urban, middle-class story.
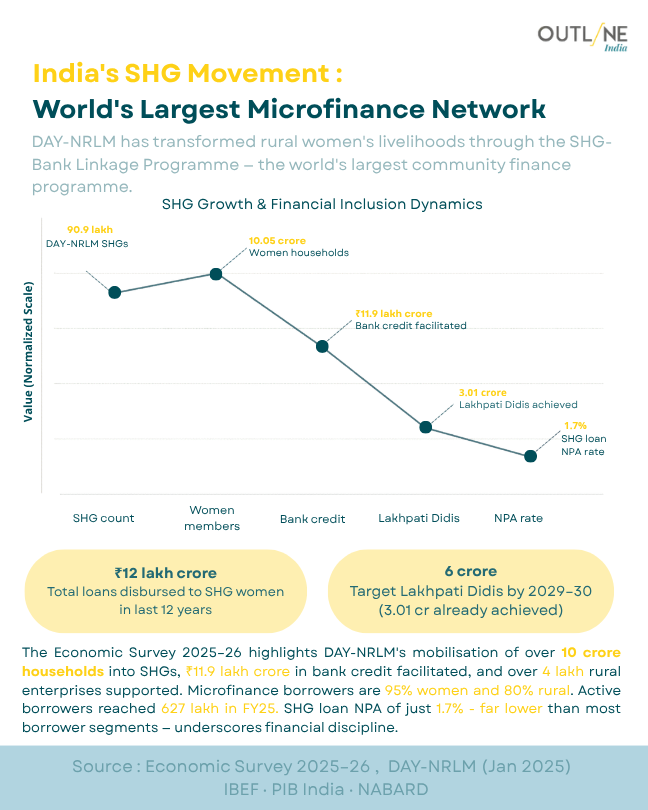
10 Crore Households, Rs.11.9 Lakh Crore in Credit, 1.7% NPA — and the Question the Data Does Not Ask Is What the Loans Were For DAY-NRLM has mobilised over 10 crore households into Self Help Groups, facilitated Rs.11.9 lakh crore in bank credit, achieved 3.01 crore Lakhpati Didis against a 2029–30 target of 6 crore, and maintained an SHG loan NPA rate of just 1.7%. Over 4 lakh rural enterprises are supported. Active borrowers reached 627 lakh in FY25, with microfinance borrowers 95% women and 80% rural. Total loans disbursed to SHG women in 12 years stand at Rs.12 lakh crore. The 1.7% NPA rate — lower than most borrower segments — is cited as evidence of financial discipline. What it may also reflect is the social pressure within groups to maintain repayment regardless of the loan's productive outcome: whether the loan generated income, covered a medical emergency, serviced an earlier debt, or funded a daughter's marriage is a distribution the NPA figure cannot distinguish. Access to credit is not the same as access to economic mobility.
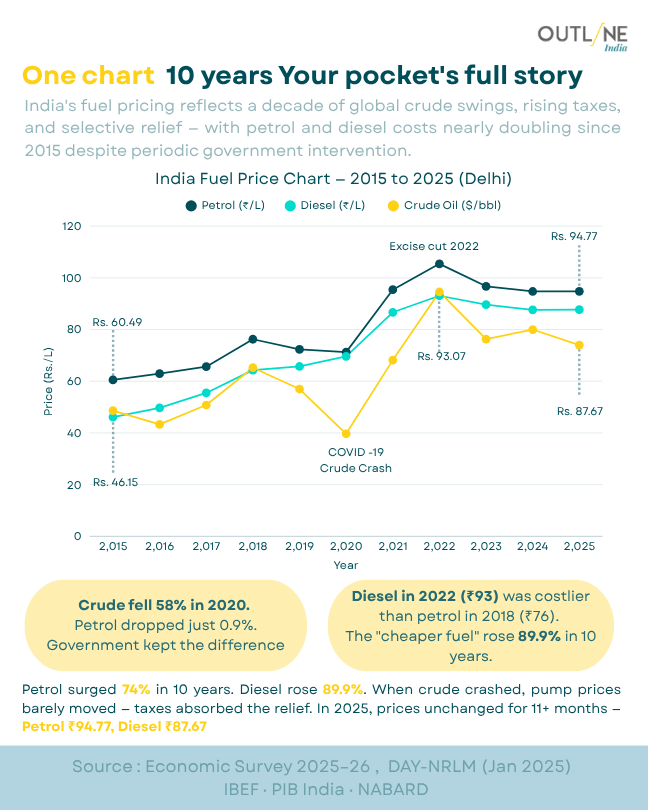
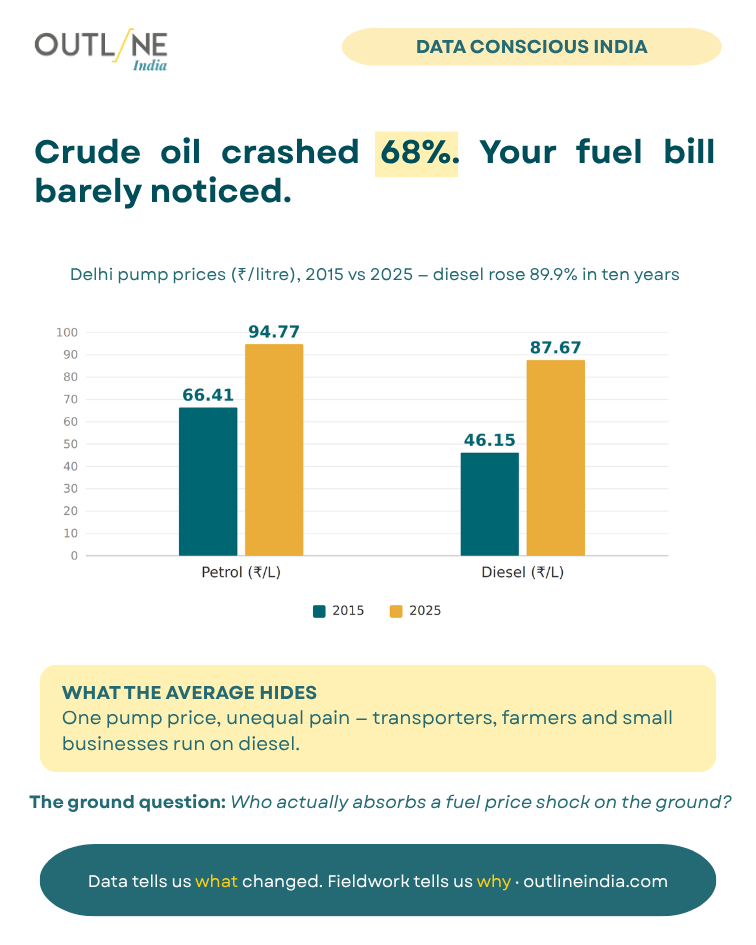
The Hidden Force Behind Every Litre You Buy India imports approximately 85% of its crude oil, making domestic fuel prices deeply sensitive to global market swings — yet the price consumers pay at the pump is shaped as much by taxation as by crude oil costs. Global crude prices swung from a COVID-era low of $41.62 per barrel in 2020 to a decade-high of $96.35 per barrel in 2022, before easing to around $75 per barrel by April 2025. Domestic retail prices, however, did not fully mirror this decline, because taxes — which often exceed 50% of the pump price — remained largely stable. The Indian Basket crude oil price reflects the specific blend India imports; it is a useful indicator, but pump prices are the product of policy choices as much as market forces.
NPS Assets Under Management — A Decade of Compounding India's NPS AUM surged 1,800% over ten years, rising from ₹0.75 lakh crore in 2015 to ₹14.43 lakh crore by 2025, while subscriber numbers grew from 1 crore to over 8 crore. Equity returns fluctuated year on year — touching as low as 5% in FY2020 and as high as 26.56% in FY2025 — yet long-term compounding delivered a 13.65% return since inception. The COVID market crash produced only a 3% dip in AUM, stabilised by the bond allocation that cushioned equity losses. The bar-and-line chart illustrates how contributions, subscriber growth, and market performance compounded together: a scheme once treated as a minor retirement supplement has become one of India's most significant long-term savings platforms.
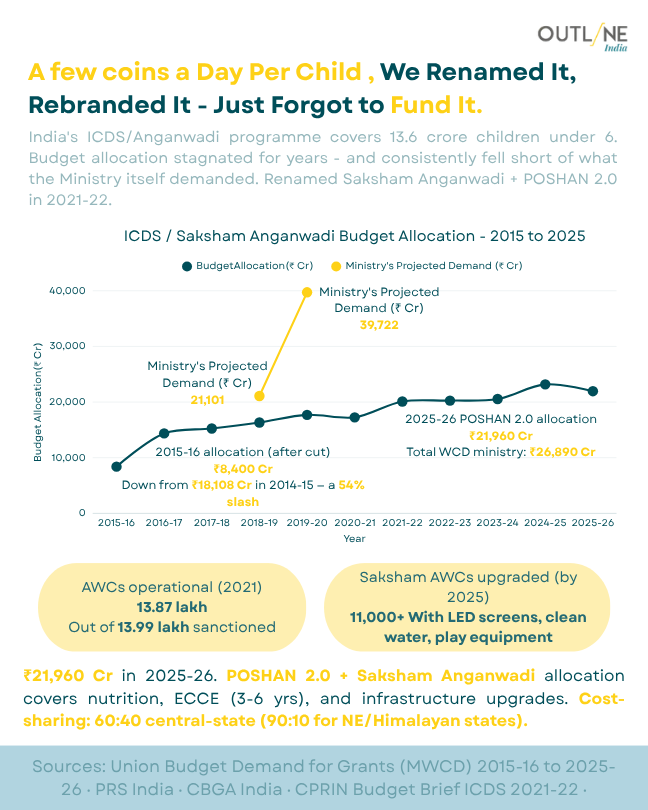
A Few Coins a Day Per Child — We Renamed It, Rebranded It, Just Forgot to Fund It India's ICDS programme, now rebranded as Saksham Anganwadi and POSHAN 2.0, covers 13.6 crore children under 6 — yet budget allocations have consistently fallen short of the Ministry's own projected demands. In 2015–16, the budget was cut from ₹18,108 crore to ₹8,400 crore — a 54% slash — and though allocations rose to ₹21,960 crore by 2025–26, the Ministry's projected demand of ₹39,722 crore remains unmet by nearly half. Of 13.99 lakh sanctioned Anganwadi centres, 13.87 lakh were operational as of 2021. Over 11,000 Saksham AWCs have been upgraded with LED screens, clean water, and play equipment. The rebranding has been thorough; the funding, less so.
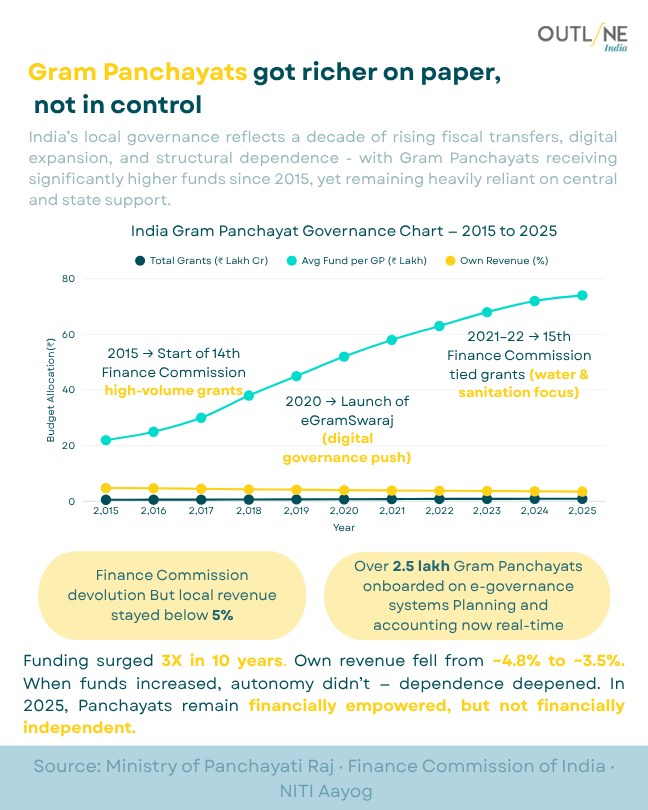
Gram Panchayats Got Richer on Paper — Not in Control India's Gram Panchayats received significantly higher fiscal transfers over the past decade — funds tripling since 2015 through successive Finance Commission grants, with average funds per GP rising sharply and over 2.5 lakh Panchayats onboarded to e-governance platforms like eGramSwaraj. Yet own revenue generation remained stubbornly below 5% throughout, falling slightly from around 4.8% to 3.5%. More money arrived from the centre and states, but local financial autonomy did not grow alongside it. In 2025, India's Panchayats are financially empowered in the sense of receiving resources — but financially dependent in the sense of generating almost none of their own.
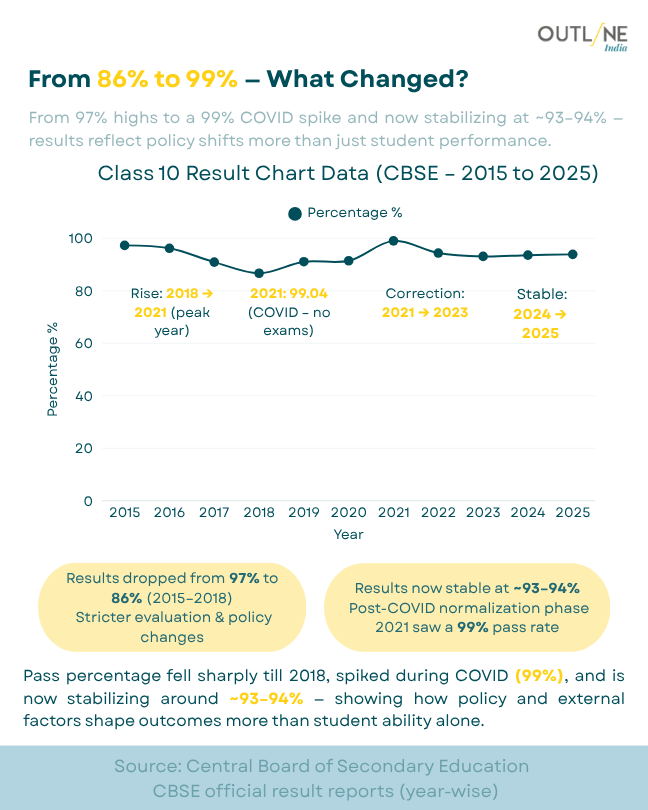
From 86% to 99% — What Changed? India's CBSE Class 10 pass percentage fell from around 97% in 2015 to 86% by 2018 under stricter evaluation policies, then climbed to a record 99.04% in 2021 when no physical examinations were held due to COVID-19. Post-pandemic normalisation pulled the figure back down, and by 2024–25 it had stabilised at approximately 93–94%. The trajectory reveals that pass rates are shaped as much by policy decisions — evaluation rigour, examination modality, marking schemes — as by actual student performance. The COVID spike, while technically an outlier, highlights how administrative choices can produce statistical outcomes that have little to do with learning.
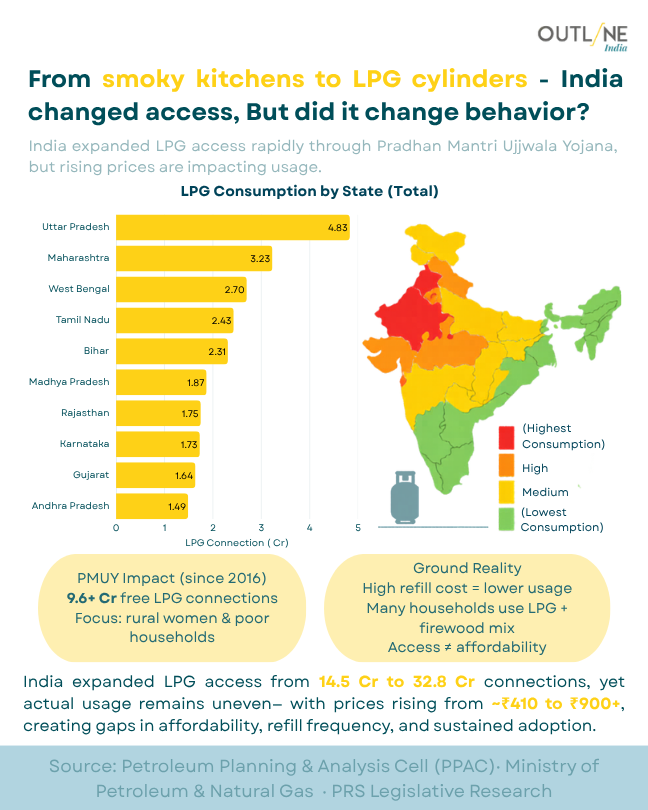
From Smoky Kitchens to LPG Cylinders — India Changed Access, But Did It Change Behavior? India's Pradhan Mantri Ujjwala Yojana (PMUY) distributed over 9.6 crore free LPG connections since 2016, expanding total connections from 14.5 crore to 32.8 crore. Uttar Pradesh leads in absolute LPG connections at 4.83 crore, followed by Maharashtra at 3.23 crore and West Bengal at 2.70 crore. Yet access has not guaranteed sustained use — refill prices rose from approximately ₹410 to ₹900 per cylinder, pushing many households, especially in rural areas, to rely on a mix of LPG and firewood. The data separates access from affordability: having a connection does not mean it is regularly used. For the rural poor, the cylinder arrived — but the economics of refilling it often did not.
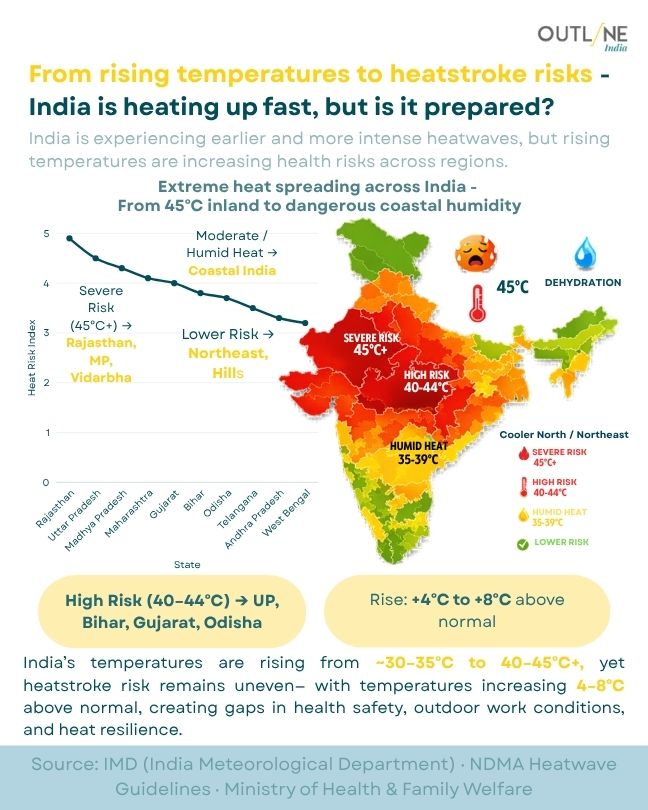
From Rising Temperatures to Heatstroke Risks — India Is Heating Up Fast, But Is It Prepared? India is experiencing more frequent and more intense heatwaves, with temperatures in high-risk regions like Rajasthan, Madhya Pradesh, and Vidarbha regularly exceeding 45°C — between 4°C and 8°C above historical norms. Uttar Pradesh, Bihar, Gujarat, and Odisha face high-risk heat conditions in the 40–44°C range, while coastal India contends with humid heat at 35–39°C that is physiologically more dangerous than dry heat at equivalent temperatures. The Northeast and hilly regions remain at lower risk. With heat-related health emergencies rising, gaps in outdoor worker protection, emergency response systems, and public health preparedness remain significant — particularly in states where extreme heat overlaps with dense informal labour.
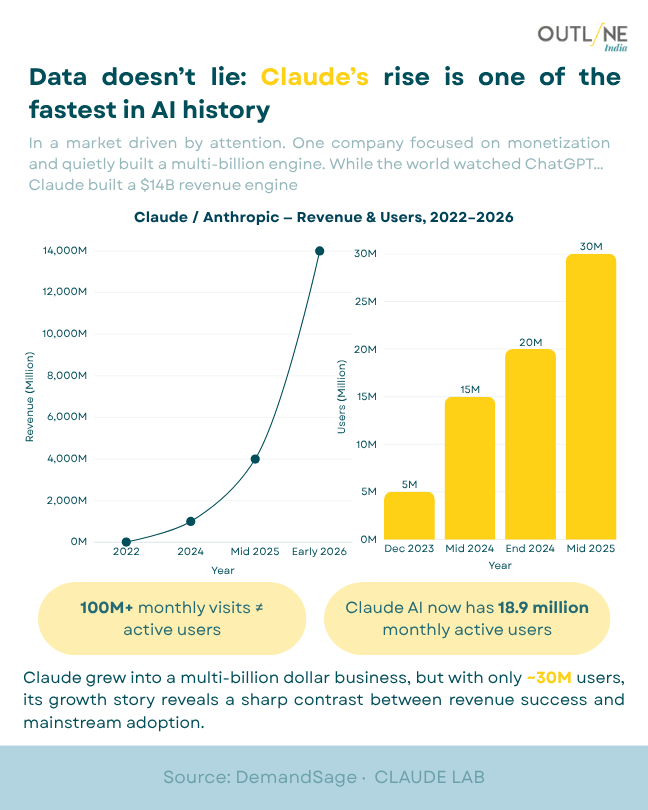
Data Doesn't Lie: Claude's Rise Is One of the Fastest in AI History Anthropic's Claude AI built a multi-billion dollar revenue engine largely outside the public spotlight that followed ChatGPT. Revenue grew from near zero in 2022 to approximately $4 billion by mid-2025 and a projected $14 billion by early 2026. Monthly active users grew from 5 million in December 2023 to 20 million by end-2024, with projections reaching 30 million by mid-2025. However, with 18.9 million monthly active users against 100+ million monthly web visits, the gap between traffic and active engagement is notable. Claude's growth story is one of B2B adoption and enterprise integration — rapid in revenue, more selective in mainstream user reach.
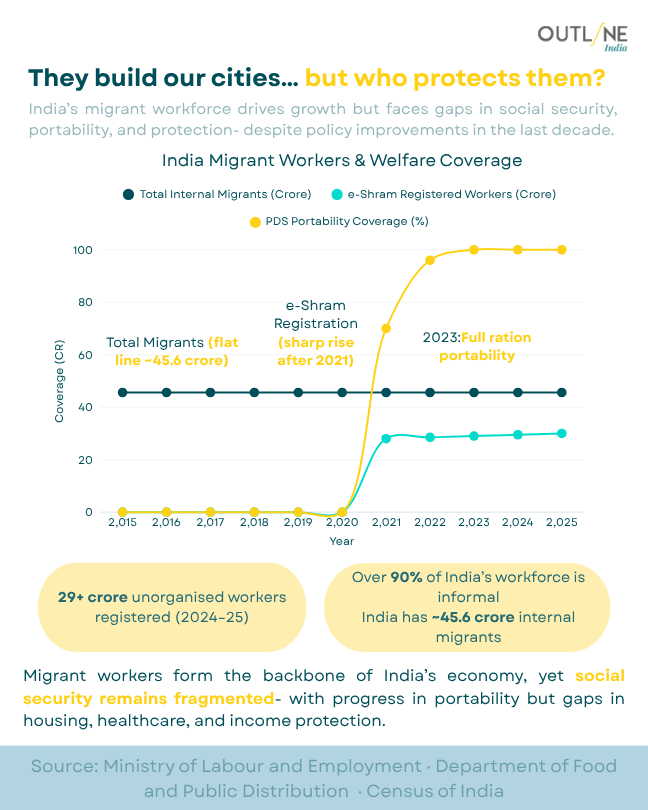
45.6 Crore Internal Migrants, 29+ Crore Registered on e-Shram — They Built the Cities and Cannot Access the Services in Them India has approximately 45.6 crore internal migrants and 29+ crore unorganised workers registered on the e-Shram portal as of 2024–25. PDS portability reached full ration portability in 2023, allowing migrants to access their food entitlement across state lines — a significant policy achievement. The e-Shram registration represents a sharp rise after 2021. Over 90% of India's workforce is informal. Yet social security for migrant workers remains fragmented, with progress in portability but persistent gaps in housing, healthcare, and income protection. A registration portal and a PDS card are necessary conditions for welfare portability, not sufficient ones. A migrant worker who is registered on e-Shram and entitled to portable rations still faces hospitals that do not recognise their state health card, schools that do not enrol their children mid-year, and rental markets that charge a premium for their precarity. Registration is the beginning of a welfare architecture. India has built the beginning and called it the policy.
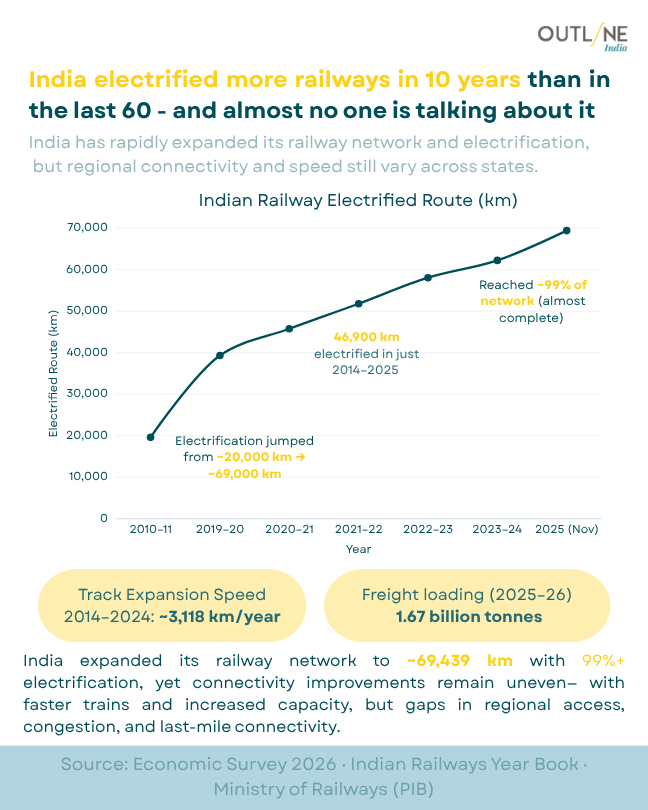
India Electrified More Railways in 10 Years Than in the Last 60 — And Almost No One Is Talking About It India's railway electrification expanded from approximately 20,000 km in 2010–11 to over 69,000 km by November 2025 — with 46,900 km added in the single decade between 2014 and 2025, at an average pace of roughly 3,118 km per year. The network now stands at nearly 99% electrified. Freight loading reached 1.67 billion tonnes in 2025–26. Yet despite this infrastructure achievement, regional connectivity disparities persist — last-mile access remains uneven, congestion continues in high-demand corridors, and train speed improvements are not uniformly distributed across the network. The electrification story is one of scale and speed; the equity story is more complicated.
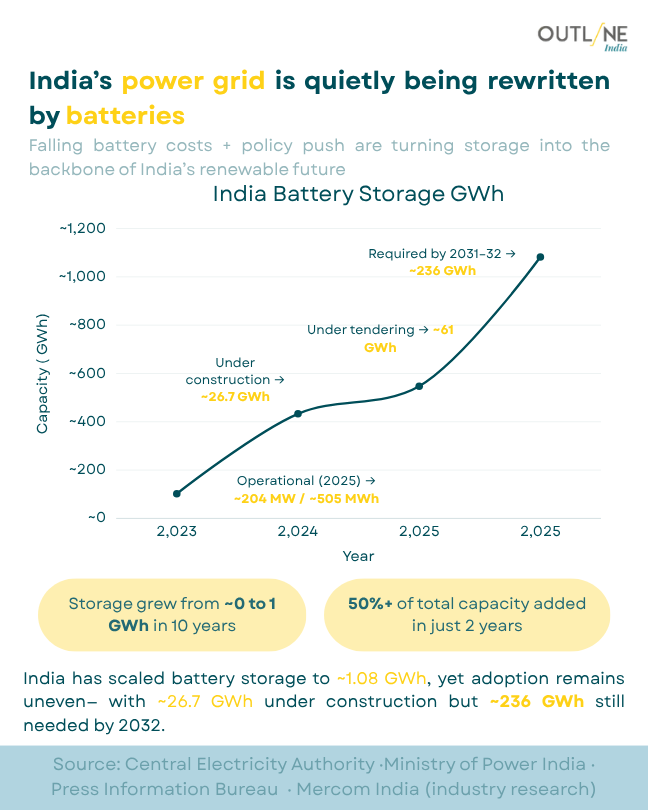
India's Power Grid Is Quietly Being Rewritten by Batteries India went from near-zero to approximately 1 GWh of operational battery storage in just ten years — and more than half of that came in the last two. As of 2025, operational capacity stands at around 204 MW / 505 MWh, with 26.7 GWh under construction and 61 GWh under tendering. Yet the scale of the challenge ahead is stark: 236 GWh of additional storage is still required by 2031–32 to support India's renewable energy targets. Solar and wind generation without storage is intermittent — batteries are what make the transition to renewables actually reliable. The infrastructure is accelerating, but the gap between current capacity and what is needed by 2032 means the race has barely begun.
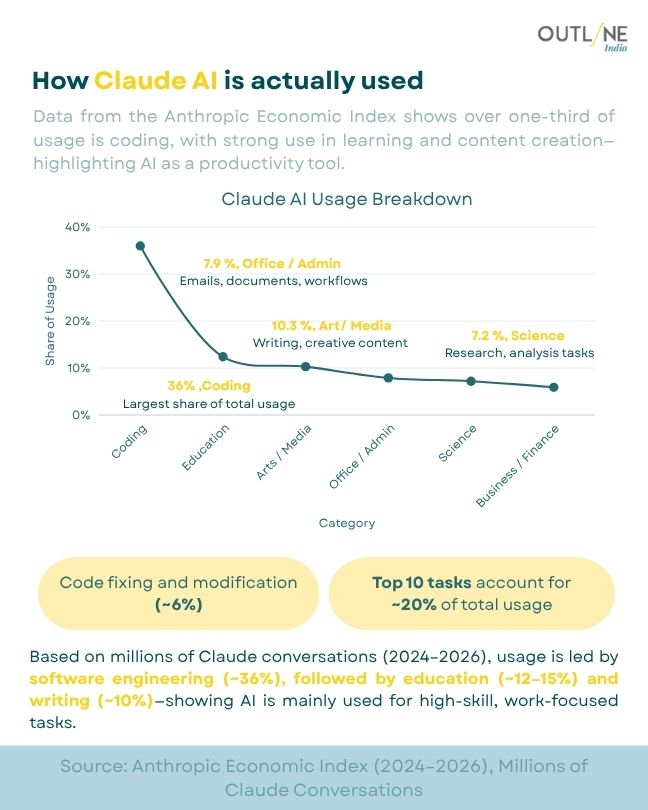
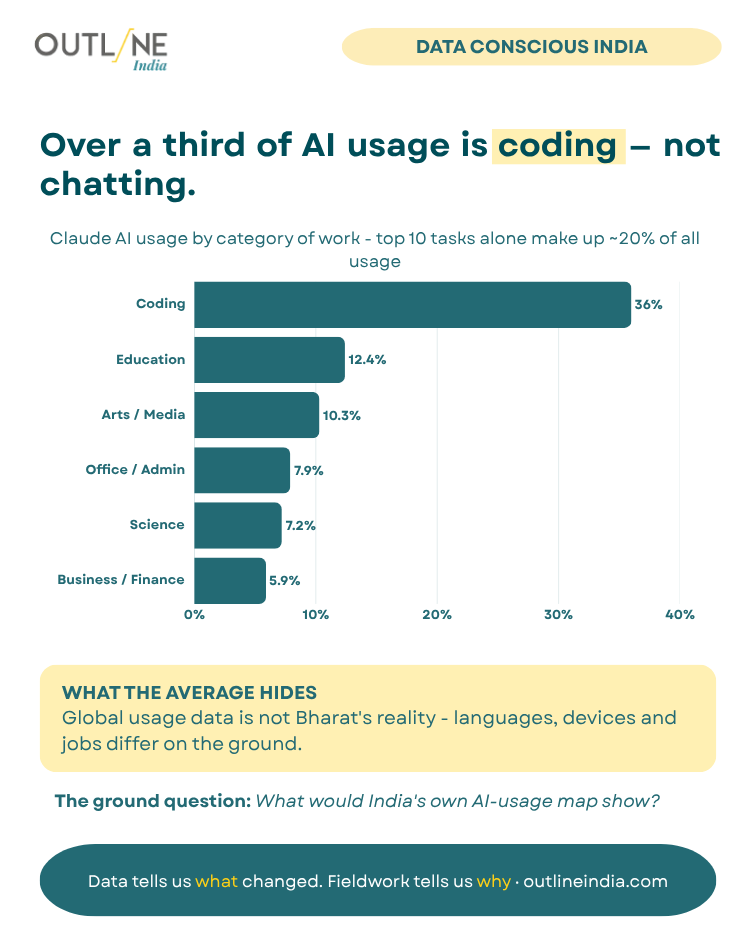
Data from the Anthropic Economic Index across millions of Claude conversations (2024–2026) shows that coding dominates Claude's usage at approximately 36% — the single largest share — followed by education at 12–15% and writing or content creation at around 10%. Office and administrative tasks account for 7.9%, arts and media for 10.3%, and science and research tasks for 7.2%. Business and finance use is smaller still. The top 10 individual tasks collectively represent only about 20% of total usage, suggesting that Claude is used for a wide diversity of specific purposes. The pattern reinforces a picture of AI as a high-skill productivity tool — most heavily used in software development, learning, and knowledge work.
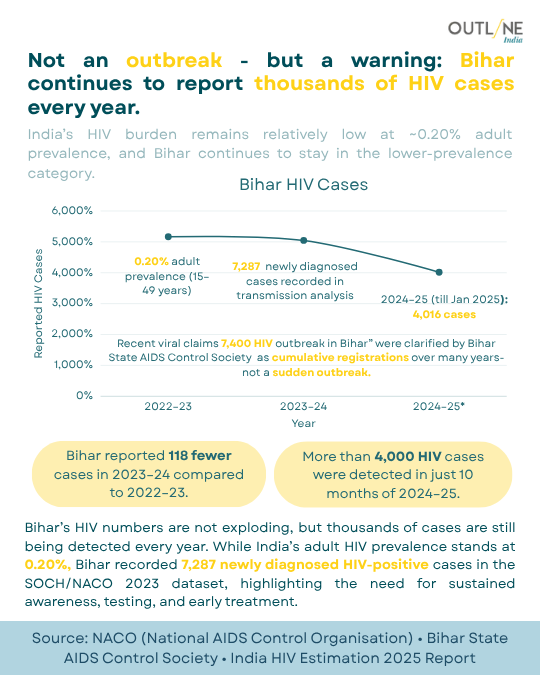
Bihar’s HIV numbers are not exploding — but they remain a serious public health concern. While viral posts claimed a “7,400 HIV outbreak,” official NACO and Bihar State AIDS Control Society data show these were cumulative newly diagnosed cases, not a sudden outbreak. India’s adult HIV prevalence remains relatively low at ~0.20%, yet Bihar still recorded thousands of HIV-positive detections across recent years. More than 4,000 cases were identified in just the first 10 months of 2024–25, highlighting that awareness, testing, prevention, and early treatment efforts still need continuous strengthening.
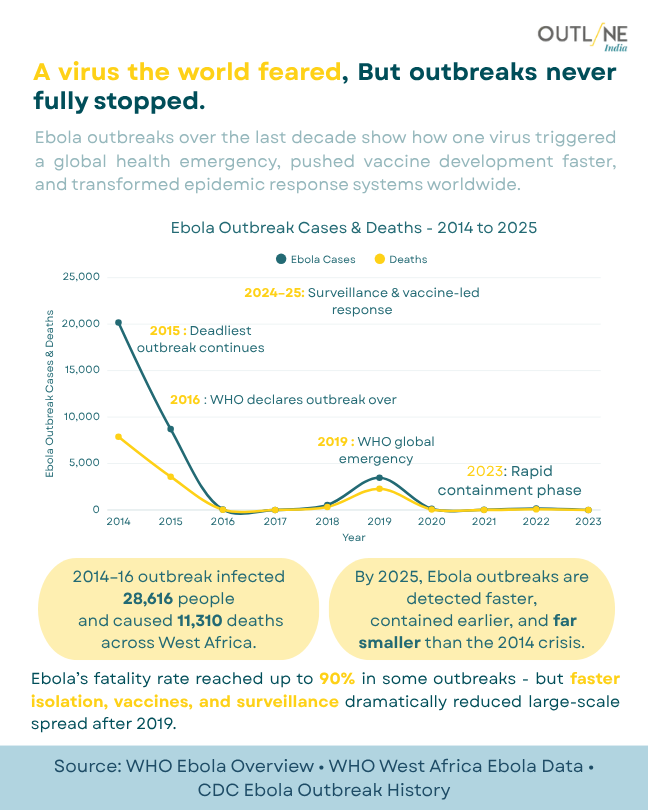
Ebola once triggered a global health emergency that shook the world. The 2014–16 outbreak infected 28,000+ people and caused 11,000+ deaths across West Africa. But the story after 2019 changed: faster detection, vaccines, isolation systems, and global surveillance dramatically reduced large-scale spread. The virus still appears in outbreaks — but the response is now faster than ever.
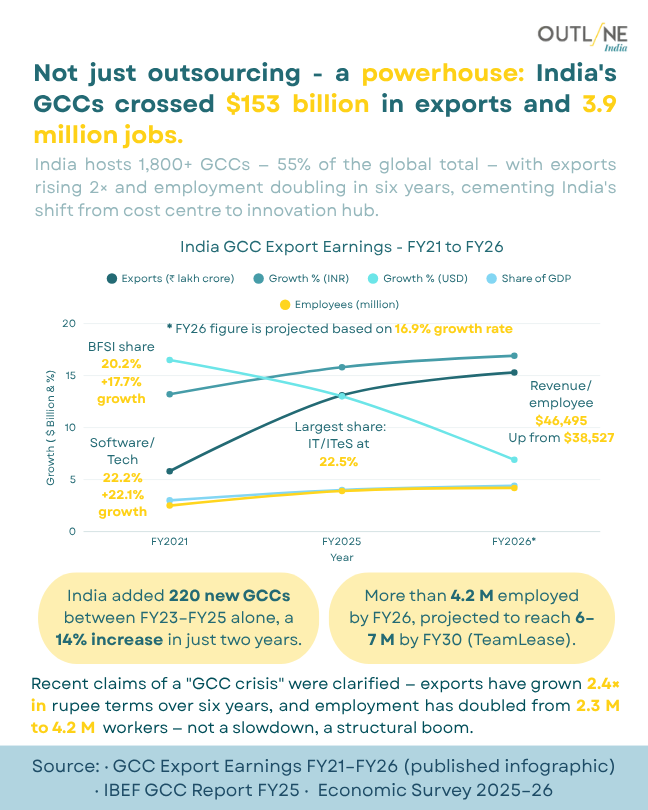
3:04 PMClaude responded: Not Just Outsourcing — A Powerhouse: India's GCCs Crossed $153 Billion in Exports and 3.Not Just Outsourcing — A Powerhouse: India's GCCs Crossed $153 Billion in Exports and 3.9 Million Jobs The Numbers Said Back Office. The Data Says Boardroom. India now hosts 1,800+ Global Capability Centres — 55% of the global total — with exports rising 2.4× in rupee terms over six years and employment doubling from 2.5 million to 3.9 million workers. Revenue per employee climbed from $38,527 to $46,495, and India added 220 new GCCs between FY23 and FY25 alone — a 14% increase in just two years. The fastest-growing vertical in FY25 was not IT or banking but Retail and Food at 24.4%, while Software and Technology grew at 22.1% and BFSI at 17.7%. Recent claims of a "GCC crisis" were clarified as cumulative registrations, not a sudden emergency. The actual story runs in the opposite direction — exports doubled, jobs doubled, and per-worker revenue rose. A sector that grows its workforce while simultaneously deepening its skill base is not outsourcing anymore. It is ownership.
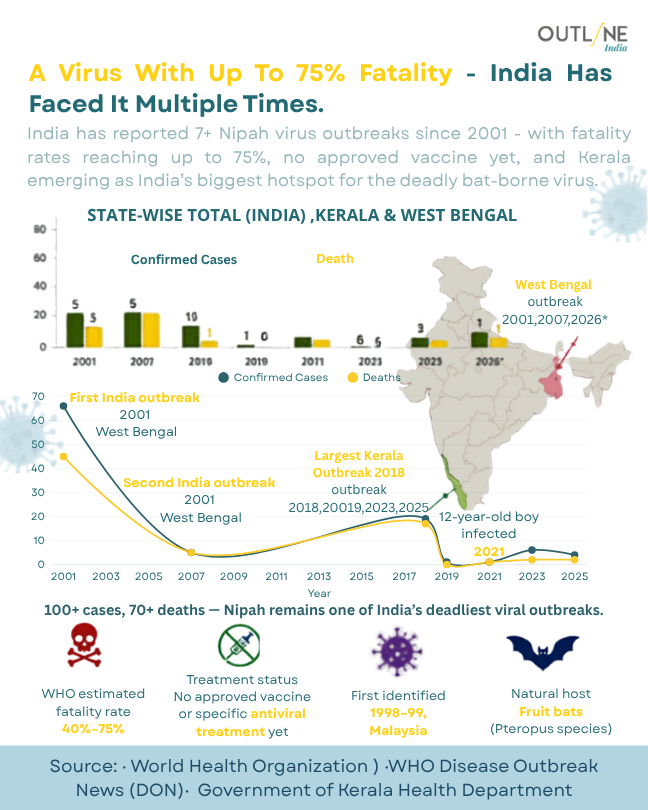
Not Just a Rare Virus — A Public Health Warning. India Has Faced Multiple Nipah Outbreaks with Fatality Rates Reaching 75%. The numbers don't show a widespread epidemic. They show an extremely deadly one. Since 2001, India has reported repeated Nipah outbreaks, with fatality rates reaching up to 75%. Kerala's rapid surveillance and contact tracing have helped contain recent outbreaks, but the absence of an approved vaccine means preparedness remains India's strongest defense.
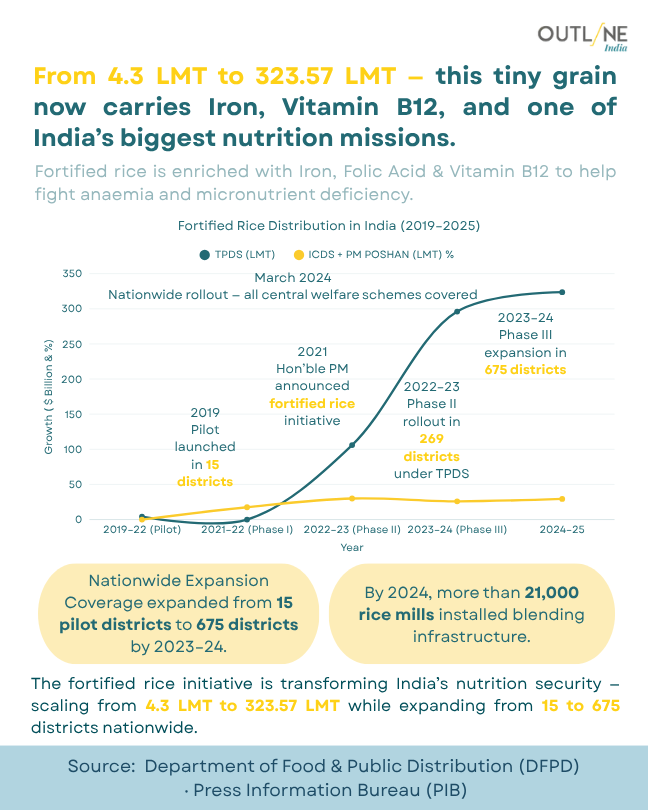
A Nutrition Revolution. India Expanded Fortified Rice Distribution from 4.3 LMT to 323.6 LMT. This isn't simply food distribution—it's nutrition at scale. Fortified rice now reaches millions through public welfare schemes, delivering essential iron, folic acid, and vitamin B12 to fight hidden hunger. In just a few years, India transformed a pilot initiative into one of the world's largest food fortification programs.
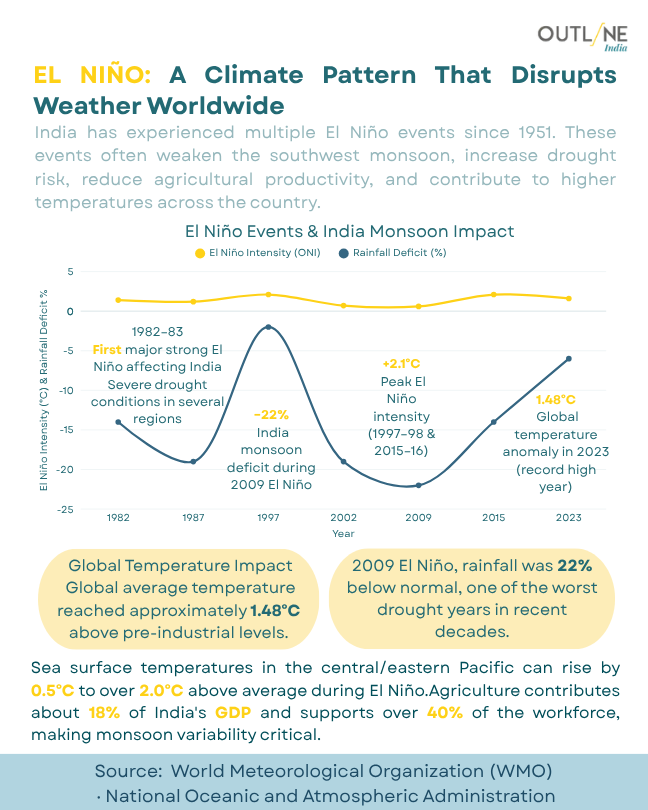
Weather Pattern — A Climate Risk Multiplier. El Niño Is Reshaping India's Agriculture, Water, and Economy. One ocean phenomenon can influence an entire nation's future. El Niño weakens monsoon rainfall, raises temperatures, increases drought risk, and disrupts agriculture. In a country where millions depend on rain-fed farming, climate variability is no longer a future concern—it's a present-day economic challenge.
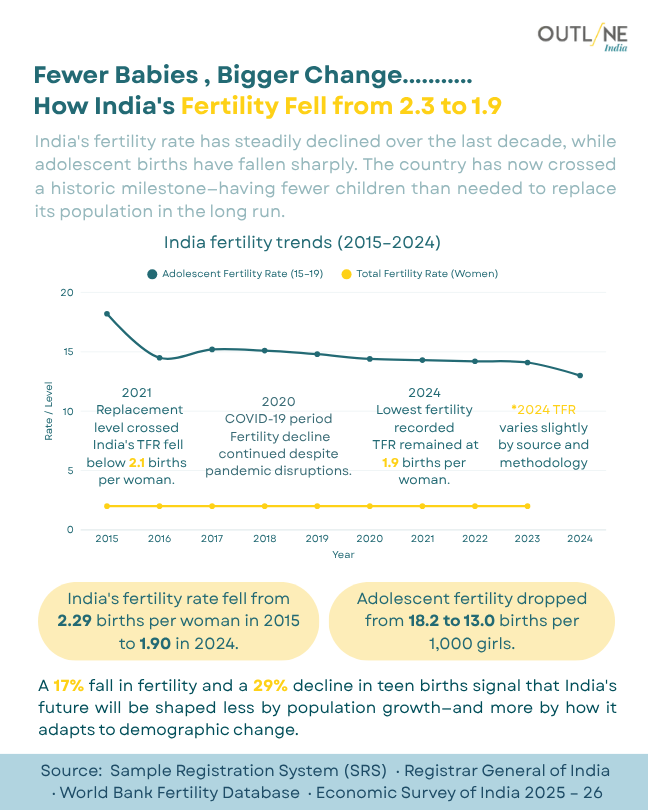
A Demographic Turning Point. India's Fertility Rate Has Fallen from 2.29 to 1.90. The numbers tell a bigger story than population decline. India has moved below replacement-level fertility, while adolescent births continue to fall. The next chapter of India's growth will depend less on population expansion and more on investments in productivity, skills, and healthy ageing.
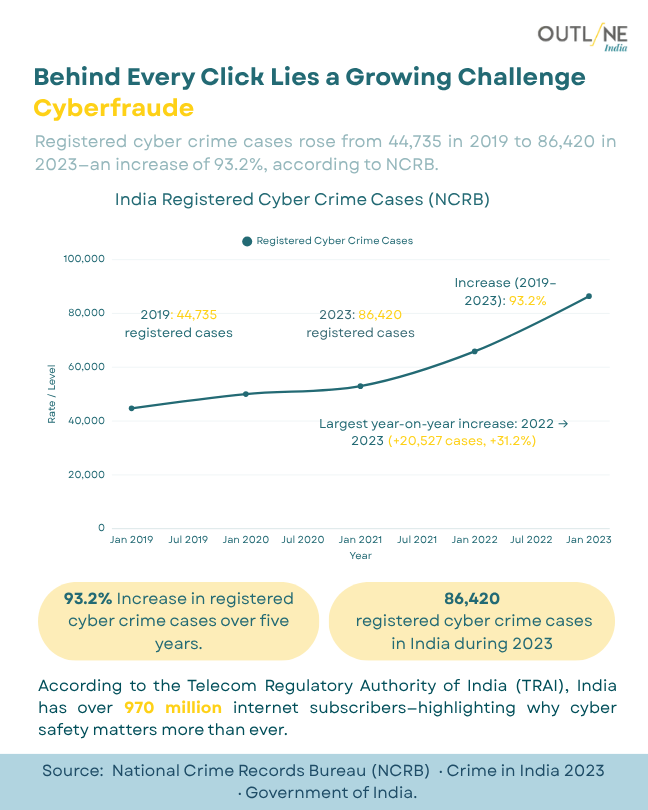
Just More Clicks — A Growing Digital Threat. Cybercrime Cases Rose 93.2% in Just Five Years. India's digital economy is expanding rapidly—and so are cyber risks. Registered cybercrime cases nearly doubled between 2019 and 2023, reflecting rising online activity and increasingly sophisticated fraud. Digital adoption must now be matched by stronger cyber awareness and security.
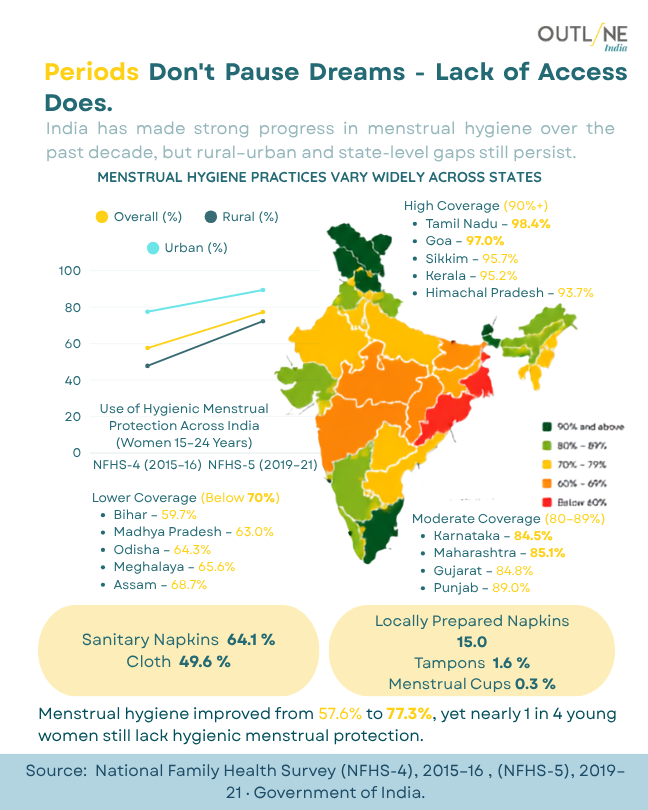
Periods — Equal Access to Opportunity. Menstrual Hygiene Is Improving, But Millions Are Still Left Behind. Progress is visible, but the gap remains. Menstrual hygiene practices have improved significantly across India, yet access continues to vary widely between states and communities. Expanding affordable products, awareness, and sanitation is essential to keeping girls healthy, confident, and in school.
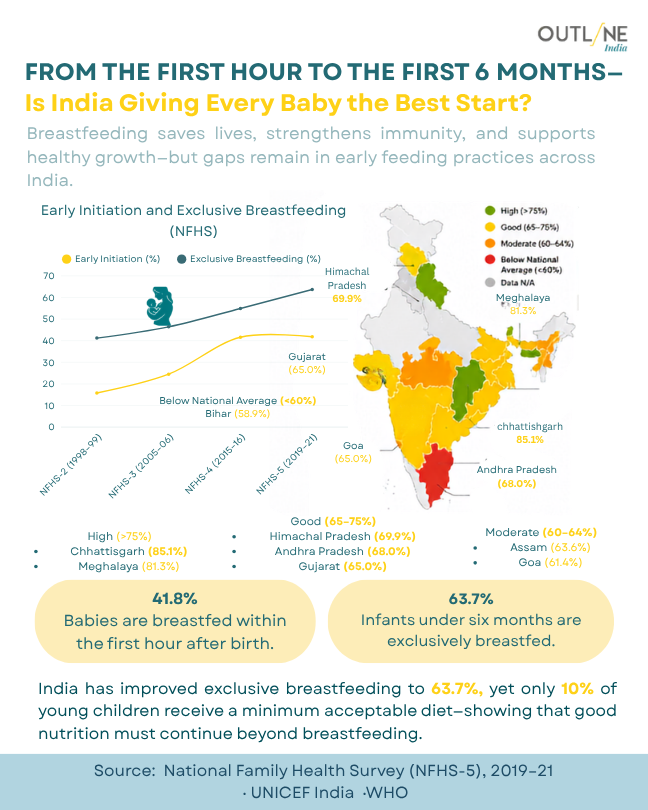
Feeding — A Child's First Investment in Health. The First Hour After Birth Can Shape a Lifetime. Breastfeeding is one of the simplest and most effective interventions for child survival. India has improved both early initiation and exclusive breastfeeding, strengthening infant nutrition and immunity. The next milestone is ensuring every newborn receives the best possible start from day one.
Rural India spent 59% of its budget on food in 1999. By 2022, it was 46% — urban fell from 48% to 39% over the same stretch. Cereals fell even faster, from 11% of rural spending to under 5% — some of that is free grain, not just richer diets.
Food's share of spending fell for two decades straight. In 2023-24, it ticked back up — 46.4% to 47% in rural India, 39.2% to 39.7% in urban. Cereals didn't drive it — their share stayed flat. Beverages, processed food and milk pushed it up.
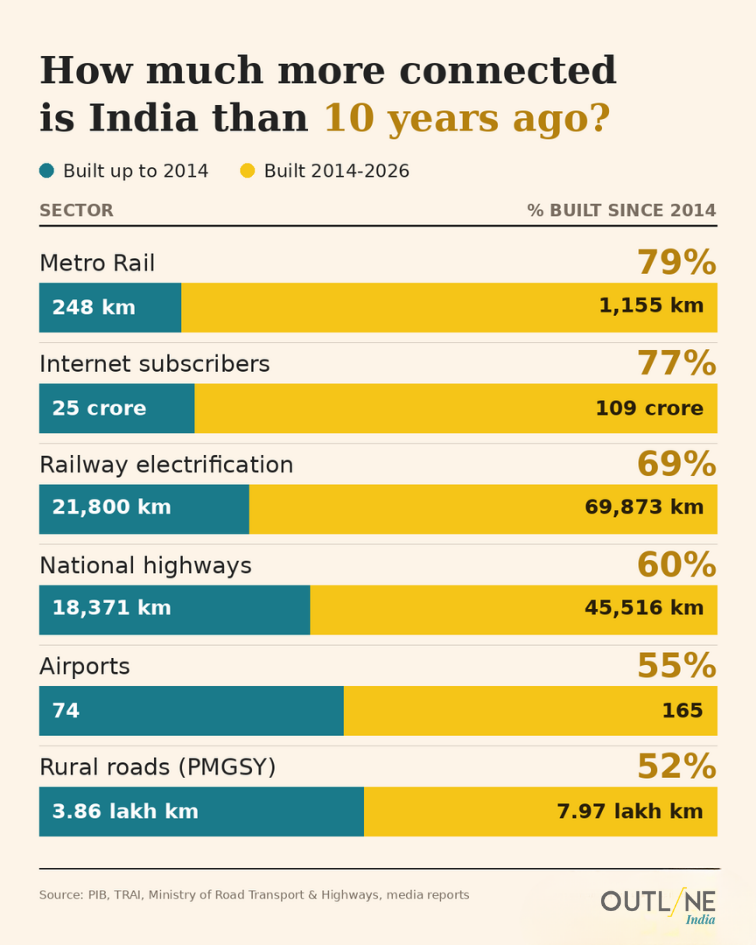
Metro rail led the decade — 79% of India's entire network was built after 2014, from 248 km to 1,155 km. Internet subscribers followed close behind at 77%. Rural roads and airports grew the slowest of the six — just over half of today's total came up since 2014.
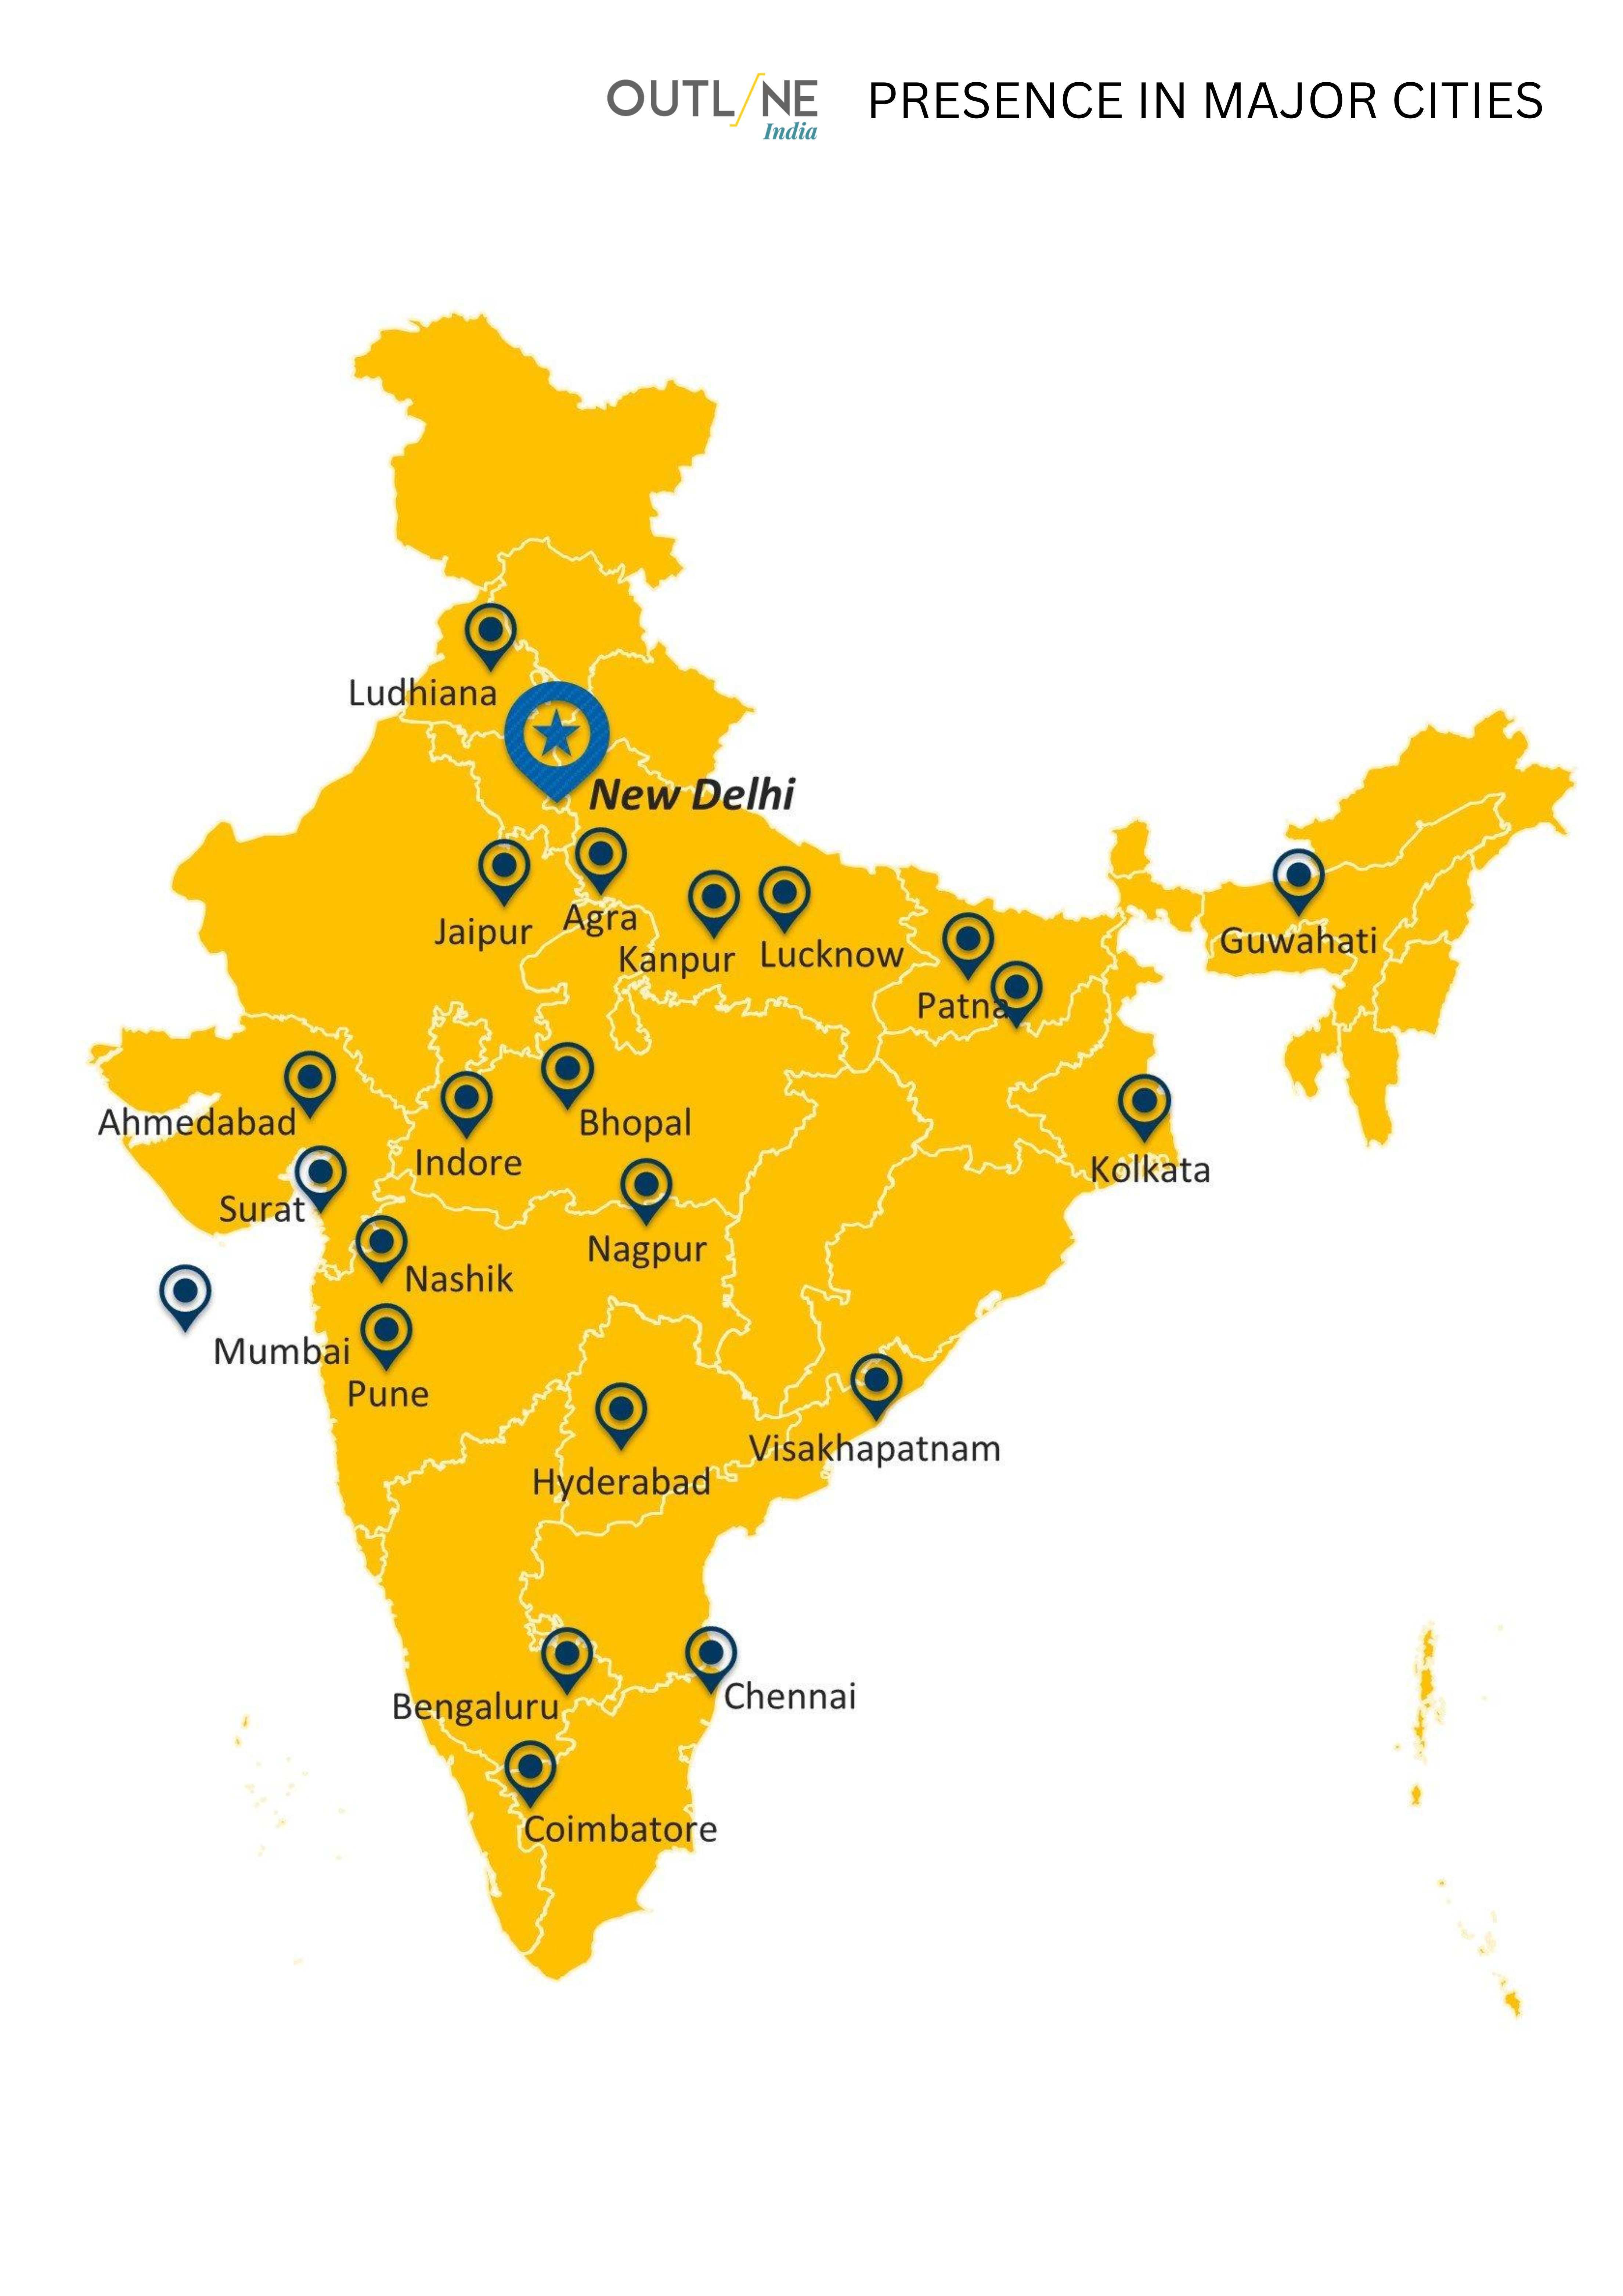
OI FOOTSTEPS:-From Delhi to Coimbatore — Outline India's Research Footprint Spans the Country's Diversity Outline India's field presence spans eight states — Delhi, Haryana, Rajasthan, Andhra Pradesh, Assam, Uttar Pradesh, Maharashtra, and Kerala — and extends across more than 20 major cities including New Delhi, Lucknow, Jaipur, Kanpur, Agra, Patna, Guwahati, Kolkata, Ahmedabad, Surat, Bhopal, Nagpur, Nashik, Mumbai, Pune, Visakhapatnam, Hyderabad, Bengaluru, Chennai, and Coimbatore. This geographic spread is not incidental — it reflects a deliberate effort to ground research in the regional, linguistic, and socioeconomic diversity that national-level data so often flattens into a single average. From the agrarian belts of Uttar Pradesh to the coastal economies of Andhra Pradesh, from the tribal corridors of Assam to the urban density of Mumbai, Outline India's footsteps are a methodological choice: that evidence worth acting on must first be collected where the action is needed most.
OI PRESENCE IN MAJOR CITIES IN INDIA:- 8 States, 20+ Cities — Research That Goes Where the Data Is Collected, Not Just Where It Is Presented Most research about India is conducted in a handful of cities and generalised to a billion people. Outline India's presence map — spanning Delhi, Haryana, Rajasthan, Uttar Pradesh, Assam, Andhra Pradesh, Maharashtra, and Kerala, with city-level pins from Guwahati to Coimbatore, Jaipur to Visakhapatnam — is a pushback against that habit. The footsteps graphic is literal: field research requires feet on the ground, in districts that do not make conference agendas, among communities that do not show up in convenience samples. A research organisation that pins Nagpur and Nashik alongside Mumbai, that marks Kanpur and Agra alongside Lucknow, is making an argument about whose reality counts as data. That argument is more political than it looks, and more necessary than most research methodologies acknowledge.
Newsletters
subscribe now